Estimated Value: $449,376 - $954,000
--
Bed
2
Baths
2,670
Sq Ft
$258/Sq Ft
Est. Value
About This Home
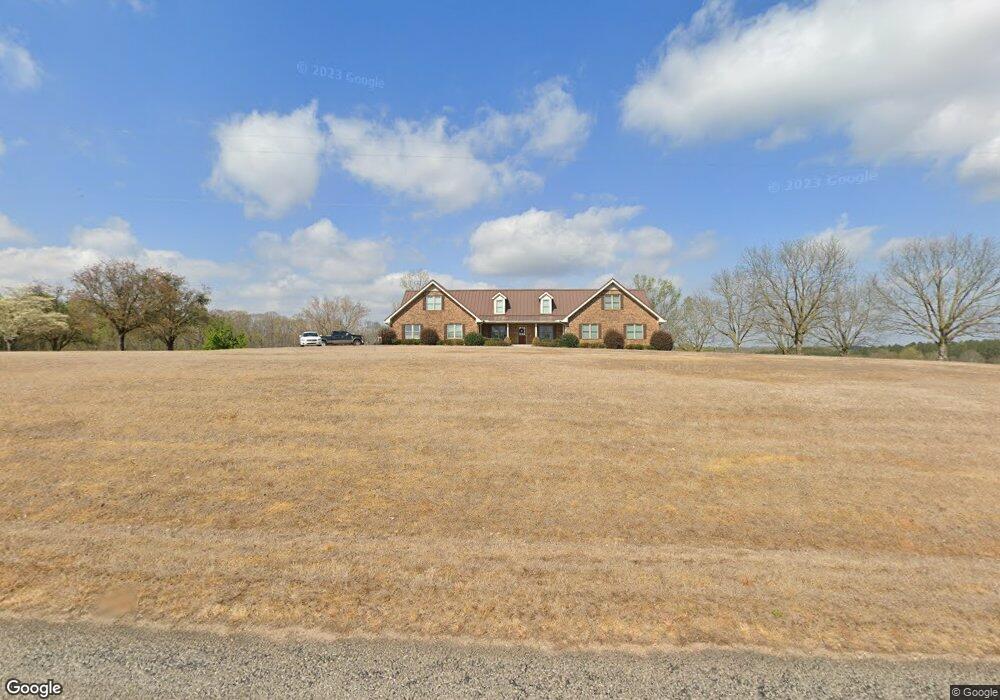
This home is located at 1138 Old Ila Rd, Hull, GA 30646 and is currently estimated at $689,844, approximately $258 per square foot. 1138 Old Ila Rd is a home located in Madison County with nearby schools including Madison County High School and Union Christian Academy.
Ownership History
Date
Name
Owned For
Owner Type
Purchase Details
Closed on
Dec 16, 2016
Sold by
Anthony
Bought by
Blalock Anthony and Blalock Faith
Current Estimated Value
Home Financials for this Owner
Home Financials are based on the most recent Mortgage that was taken out on this home.
Original Mortgage
$388,450
Outstanding Balance
$317,665
Interest Rate
3.94%
Mortgage Type
New Conventional
Estimated Equity
$372,179
Purchase Details
Closed on
Aug 12, 2016
Sold by
Chandler William W and Chandler Alice
Bought by
Blalock Anthony
Purchase Details
Closed on
Dec 27, 2012
Sold by
Chandler William Wesley
Bought by
Chandler William Wesley and Chandler Alice
Purchase Details
Closed on
May 20, 1998
Sold by
Chandler William Wesley
Bought by
Chandler Alice
Purchase Details
Closed on
Jan 1, 1989
Bought by
Chandler William Wesley
Purchase Details
Closed on
Jan 1, 1986
Bought by
Chandler William Wes
Create a Home Valuation Report for This Property
The Home Valuation Report is an in-depth analysis detailing your home's value as well as a comparison with similar homes in the area
Home Values in the Area
Average Home Value in this Area
Purchase History
| Date | Buyer | Sale Price | Title Company |
|---|---|---|---|
| Blalock Anthony | -- | -- | |
| Blalock Anthony | $285,000 | -- | |
| Chandler William Wesley | -- | -- | |
| Chandler Alice | -- | -- | |
| Chandler William Wesley | -- | -- | |
| Chandler William Wes | -- | -- |
Source: Public Records
Mortgage History
| Date | Status | Borrower | Loan Amount |
|---|---|---|---|
| Open | Blalock Anthony | $388,450 |
Source: Public Records
Tax History Compared to Growth
Tax History
| Year | Tax Paid | Tax Assessment Tax Assessment Total Assessment is a certain percentage of the fair market value that is determined by local assessors to be the total taxable value of land and additions on the property. | Land | Improvement |
|---|---|---|---|---|
| 2024 | $4,084 | $211,918 | $70,302 | $141,616 |
| 2023 | $6,008 | $196,796 | $58,585 | $138,211 |
| 2022 | $3,322 | $150,492 | $40,278 | $110,214 |
| 2021 | $2,903 | $125,154 | $40,278 | $84,876 |
| 2020 | $2,889 | $119,295 | $34,419 | $84,876 |
| 2019 | $2,864 | $117,526 | $34,419 | $83,107 |
| 2018 | $2,801 | $112,872 | $31,490 | $81,382 |
| 2017 | $3,048 | $105,860 | $29,292 | $76,568 |
| 2016 | $2,100 | $92,468 | $27,052 | $65,416 |
| 2015 | $2,041 | $92,468 | $27,052 | $65,416 |
| 2014 | $2,048 | $91,000 | $25,420 | $65,579 |
| 2013 | -- | $91,000 | $25,420 | $65,579 |
Source: Public Records
Map
Nearby Homes
- 197 Joan Smith Rd
- 4274 Highway 98 W
- 15 Pine St
- 5492 Georgia 98
- 287 Pine St
- 0 Nowhere Rd Unit 10532129
- 135 Woodpecker Pte
- 84 Woodpecker Point
- 135 Woodpecker Point
- 0 Highway 29 N Unit 10525658
- 886 Hudson Rivers Church Rd
- 1191 Aderhold Rogers Rd
- 136 Wedgewood Dr
- 280 Corey Dr
- 495 Hanley Rd
- 0 Brewer Phillips Rd Unit 10462348
- 235 Minish Lake Rd
- 0 Georgia 174 Unit 10530772
- 110 Williams Wilson Rd
- 213 Duncan Swindle Rd Unit TRACT 1
- 865 Old Ila Rd
- 865 Old Ila Rd
- 829 Old Ila Rd
- 753 Old Ila Rd
- 1246 Old Ila Rd
- 1355 Highway 106 S
- 1300 Chandler Farm Rd
- 1147 Highway 106 S
- 1141 Highway 106 S
- 972 Chandler Farm Rd
- 1444 Highway 106 S
- 1444 Highway 106 S
- 1444 Highway 106 S
- 941 Chandler Farm Rd
- 1444 Hwy 106s
- 57 Joan Smith Rd
- 1320 Highway 106 S
- 505 Lake Deerfield Rd
- 505 Lake Deerfield Rd
- 1734 Highway 106 S