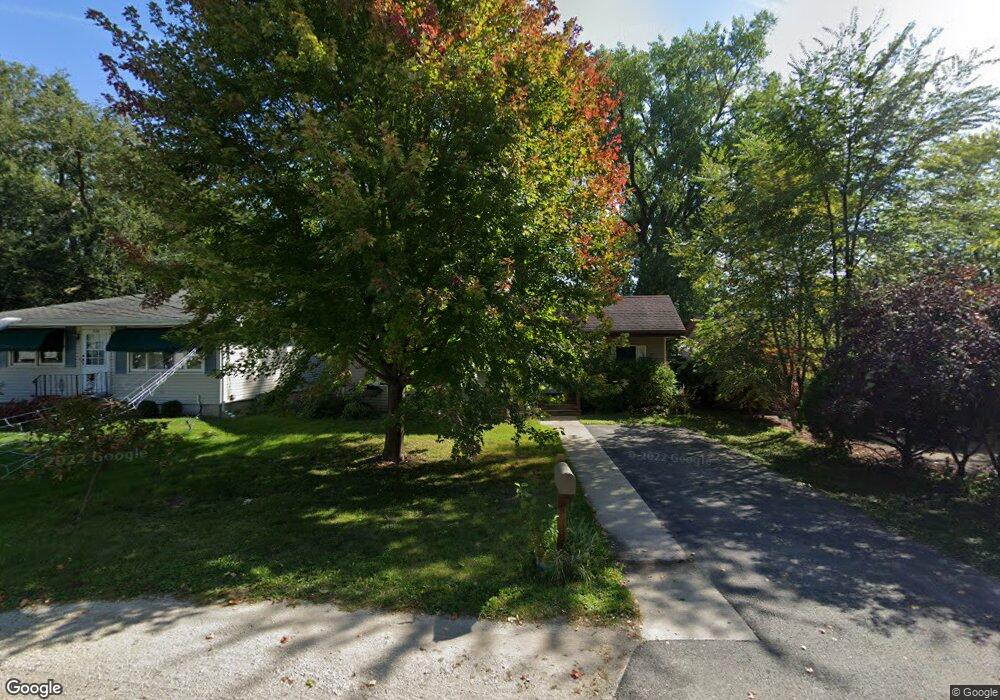
1138 Wild St Sycamore, IL 60178
Estimated Value: $202,000 - $283,000
3
Beds
1
Bath
985
Sq Ft
$234/Sq Ft
Est. Value
About This Home
This home is located at 1138 Wild St, Sycamore, IL 60178 and is currently estimated at $230,561, approximately $234 per square foot. 1138 Wild St is a home located in DeKalb County with nearby schools including Sycamore High School, St Mary's Catholic School, and Cornerstone Christian Academy.
Ownership History
Date
Name
Owned For
Owner Type
Purchase Details
Closed on
Aug 17, 2021
Sold by
Smrz Kevin C and Smrz Cassandra J
Bought by
Oldham Brandon
Current Estimated Value
Purchase Details
Closed on
Jun 24, 2011
Sold by
Pavelich May Inc
Bought by
Smrz Kevin C and Smrz Cassandra J
Purchase Details
Closed on
May 18, 2009
Sold by
Deutsche Bank Natl Trt Co
Bought by
Pavelich May Inc
Home Financials for this Owner
Home Financials are based on the most recent Mortgage that was taken out on this home.
Original Mortgage
$27,500
Interest Rate
4.85%
Mortgage Type
New Conventional
Purchase Details
Closed on
Feb 6, 2008
Sold by
Dekalb County Sheriff
Bought by
Fremont Investment & Loan
Purchase Details
Closed on
Sep 28, 2006
Sold by
Hopkins Johnnie Mae
Bought by
Nelson Sherman
Home Financials for this Owner
Home Financials are based on the most recent Mortgage that was taken out on this home.
Original Mortgage
$124,000
Interest Rate
10.65%
Mortgage Type
Balloon
Create a Home Valuation Report for This Property
The Home Valuation Report is an in-depth analysis detailing your home's value as well as a comparison with similar homes in the area
Home Values in the Area
Average Home Value in this Area
Purchase History
| Date | Buyer | Sale Price | Title Company |
|---|---|---|---|
| Oldham Brandon | $109,500 | None Available | |
| Smrz Kevin C | $140,000 | -- | |
| Pavelich May Inc | $55,000 | -- | |
| Deutsche Bank Natl Trt Co | -- | -- | |
| Fremont Investment & Loan | -- | -- | |
| Nelson Sherman | $155,000 | -- |
Source: Public Records
Mortgage History
| Date | Status | Borrower | Loan Amount |
|---|---|---|---|
| Previous Owner | Pavelich May Inc | $27,500 | |
| Previous Owner | Nelson Sherman | $124,000 |
Source: Public Records
Tax History
| Year | Tax Paid | Tax Assessment Tax Assessment Total Assessment is a certain percentage of the fair market value that is determined by local assessors to be the total taxable value of land and additions on the property. | Land | Improvement |
|---|---|---|---|---|
| 2024 | $4,691 | $62,558 | $12,329 | $50,229 |
| 2023 | $4,662 | $58,525 | $11,534 | $46,991 |
| 2022 | $4,662 | $55,855 | $11,008 | $44,847 |
| 2021 | $5,064 | $53,180 | $10,481 | $42,699 |
| 2020 | $4,971 | $51,521 | $10,154 | $41,367 |
| 2019 | $4,219 | $49,359 | $9,728 | $39,631 |
| 2018 | $3,736 | $43,711 | $14,047 | $29,664 |
| 2017 | $3,596 | $41,614 | $13,373 | $28,241 |
| 2016 | $3,435 | $39,111 | $12,569 | $26,542 |
| 2015 | $3,976 | $36,727 | $11,803 | $24,924 |
| 2014 | $3,976 | $35,348 | $11,360 | $23,988 |
| 2013 | $3,976 | $36,630 | $11,772 | $24,858 |
Source: Public Records
Map
Nearby Homes
- 206 Becker Place
- 215 Becker Place
- 216 Becker Place
- 962 Bailey Rd
- 1049 Juniper Dr
- 1008 Nottingham Rd
- 1025 Juniper Dr
- 922 Nottingham Rd
- 914 Nottingham Rd
- 935 Juniper Dr
- 927 Juniper Dr
- 418 Fairway Ln
- 919 Juniper Dr
- 432 Fairway Ln
- 932 Juniper Dr
- 429 Fairway Ln
- 924 Juniper Dr
- 916 Juniper Dr
- 732 Park Ave
- 1238 Parkside Dr
Your Personal Tour Guide
Ask me questions while you tour the home.