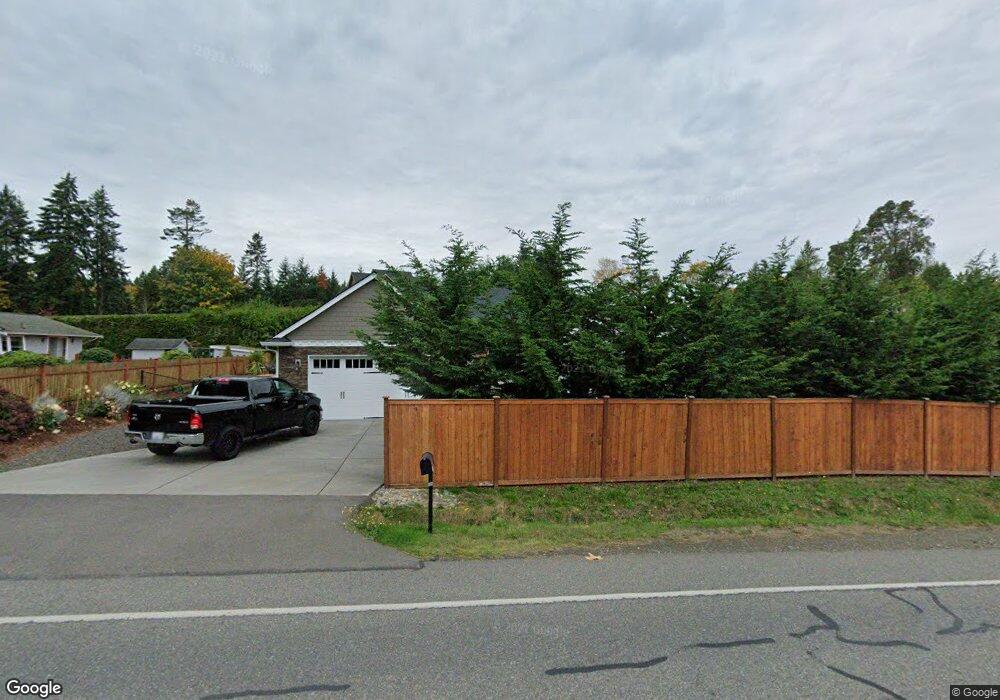
11382 SE Sedgwick Rd Port Orchard, WA 98366
Southworth NeighborhoodEstimated Value: $539,640 - $712,000
3
Beds
1
Bath
1,595
Sq Ft
$395/Sq Ft
Est. Value
About This Home
This home is located at 11382 SE Sedgwick Rd, Port Orchard, WA 98366 and is currently estimated at $629,660, approximately $394 per square foot. 11382 SE Sedgwick Rd is a home located in Kitsap County with nearby schools including South Colby Elementary School, John Sedgwick Middle School, and South Kitsap High School.
Ownership History
Date
Name
Owned For
Owner Type
Purchase Details
Closed on
Mar 4, 2020
Sold by
Adams Brandon E and Adams Heather
Bought by
Miller Angela L
Current Estimated Value
Home Financials for this Owner
Home Financials are based on the most recent Mortgage that was taken out on this home.
Original Mortgage
$155,000
Outstanding Balance
$137,242
Interest Rate
3.6%
Mortgage Type
New Conventional
Estimated Equity
$492,418
Purchase Details
Closed on
Apr 26, 2016
Sold by
Advantage Construction Llc
Bought by
Adams Brandon E and Adams Heather
Purchase Details
Closed on
Nov 11, 2014
Sold by
Olyai Nayereh Sadat and Ziazadeh Ninos
Bought by
Advantage Construction Llc
Create a Home Valuation Report for This Property
The Home Valuation Report is an in-depth analysis detailing your home's value as well as a comparison with similar homes in the area
Home Values in the Area
Average Home Value in this Area
Purchase History
| Date | Buyer | Sale Price | Title Company |
|---|---|---|---|
| Miller Angela L | $485,000 | Land Ttl Co Silverdale Submi | |
| Adams Brandon E | -- | None Available | |
| Advantage Construction Llc | $50,000 | Land Title |
Source: Public Records
Mortgage History
| Date | Status | Borrower | Loan Amount |
|---|---|---|---|
| Open | Miller Angela L | $155,000 |
Source: Public Records
Tax History Compared to Growth
Tax History
| Year | Tax Paid | Tax Assessment Tax Assessment Total Assessment is a certain percentage of the fair market value that is determined by local assessors to be the total taxable value of land and additions on the property. | Land | Improvement |
|---|---|---|---|---|
| 2026 | $4,389 | $500,910 | $94,440 | $406,470 |
| 2025 | $4,389 | $500,910 | $94,440 | $406,470 |
| 2024 | $4,256 | $500,910 | $94,440 | $406,470 |
| 2023 | $4,228 | $500,910 | $94,440 | $406,470 |
| 2022 | $4,043 | $400,960 | $75,420 | $325,540 |
| 2021 | $3,732 | $349,750 | $65,580 | $284,170 |
| 2020 | $3,840 | $350,180 | $53,410 | $296,770 |
| 2019 | $3,308 | $330,860 | $50,490 | $280,370 |
| 2018 | $3,453 | $257,070 | $43,810 | $213,260 |
| 2017 | $2,838 | $257,070 | $43,810 | $213,260 |
| 2016 | $441 | $250,810 | $37,550 | $213,260 |
| 2015 | $435 | $37,550 | $37,550 | $0 |
| 2014 | -- | $37,110 | $37,110 | $0 |
| 2013 | -- | $37,110 | $37,110 | $0 |
Source: Public Records
Map
Nearby Homes
- 4071 Ridge Crest Way SE
- 4294 Siana Place SE
- 3449 Viewsound Ln SE
- 7099 Wilson Creek Rd SE
- 7095 Wilson Creek Rd SE
- 10110 SE Southworth Dr
- 10526 SE Vashon Vista Dr
- 9300 Rustic Rock Ln SE
- 3228 Harper Hill Rd SE
- 0 Lot 3 SE Yeshua Ln
- 10843 Point Vashon Dr SW
- 4920 Peterson Rd SE
- 9360 SE Southworth Dr
- 10514 SW 110th St
- 10414 SW 110th St
- 4554 Westway Dr SE
- 10824 Vashon Hwy SW
- 0 SE Berry St
- 9804 SW Bunker Trail
- 8424 SE Southworth Dr
- 11557 SE Sedgwick Rd
- 11376 SE Sedgwick Rd
- 11545 SE Sedgwick Rd
- 11363 SE Sedgwick Rd
- 11400 SE Sedgwick Rd
- 11364 SE Sedgwick Rd
- 4155 Level Lloyd Ln SE
- 11592 SE Sedgwick Rd
- 11375 SE Sedgwick Rd
- 4137 Level Lloyd Ln SE
- 11352 SE Sedgwick Rd
- 11387 SE Sedgwick Rd
- 4200 Vesper Place SE Unit 101
- 4285 Vesper Place SE
- 4281 Vesper Place SE
- 11422 SE Sedgwick Rd
- 11338 SE Sedgwick Rd
- 11090 SE Southworth Dr
- 4245 Vesper Place SE
- 11401 SE Sedgwick Rd