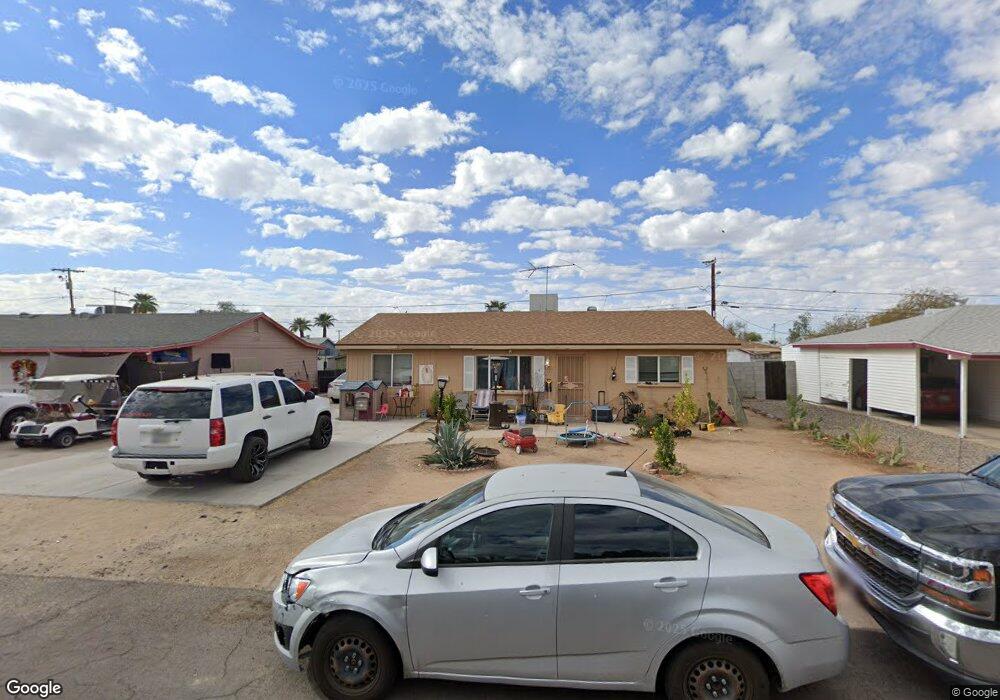
11388 N 113th Ave Youngtown, AZ 85363
Estimated Value: $212,966 - $276,000
--
Bed
1
Bath
893
Sq Ft
$284/Sq Ft
Est. Value
About This Home
This home is located at 11388 N 113th Ave, Youngtown, AZ 85363 and is currently estimated at $253,322, approximately $283 per square foot. 11388 N 113th Ave is a home located in Maricopa County with nearby schools including Country Meadows Elementary School, Raymond S. Kellis, and Desert Mirage Elementary School.
Ownership History
Date
Name
Owned For
Owner Type
Purchase Details
Closed on
Jun 20, 2012
Sold by
Samaniego Victor
Bought by
Liv Rodriguez Ramiro and Liv Ramiro Rodriguez Revocable
Current Estimated Value
Purchase Details
Closed on
May 5, 1998
Sold by
Misquez Henry S and Misquez Frances E
Bought by
Samaniego Victor
Home Financials for this Owner
Home Financials are based on the most recent Mortgage that was taken out on this home.
Original Mortgage
$52,794
Interest Rate
7.05%
Mortgage Type
FHA
Purchase Details
Closed on
May 9, 1995
Sold by
Mcwilliams Arlene S Groves and Groves Arlene S
Bought by
Misquez Henry S and Misquez Frances E
Home Financials for this Owner
Home Financials are based on the most recent Mortgage that was taken out on this home.
Original Mortgage
$34,675
Interest Rate
8.32%
Mortgage Type
New Conventional
Create a Home Valuation Report for This Property
The Home Valuation Report is an in-depth analysis detailing your home's value as well as a comparison with similar homes in the area
Home Values in the Area
Average Home Value in this Area
Purchase History
| Date | Buyer | Sale Price | Title Company |
|---|---|---|---|
| Liv Rodriguez Ramiro | -- | None Available | |
| Samaniego Victor | $52,500 | North American Title Agency | |
| Misquez Henry S | $36,500 | United Title Agency |
Source: Public Records
Mortgage History
| Date | Status | Borrower | Loan Amount |
|---|---|---|---|
| Previous Owner | Samaniego Victor | $52,794 | |
| Previous Owner | Misquez Henry S | $34,675 |
Source: Public Records
Tax History Compared to Growth
Tax History
| Year | Tax Paid | Tax Assessment Tax Assessment Total Assessment is a certain percentage of the fair market value that is determined by local assessors to be the total taxable value of land and additions on the property. | Land | Improvement |
|---|---|---|---|---|
| 2025 | $609 | $4,666 | -- | -- |
| 2024 | $575 | $4,444 | -- | -- |
| 2023 | $575 | $17,460 | $3,490 | $13,970 |
| 2022 | $558 | $13,380 | $2,670 | $10,710 |
| 2021 | $568 | $11,750 | $2,350 | $9,400 |
| 2020 | $573 | $10,050 | $2,010 | $8,040 |
| 2019 | $564 | $8,550 | $1,710 | $6,840 |
| 2018 | $547 | $6,970 | $1,390 | $5,580 |
| 2017 | $538 | $5,570 | $1,110 | $4,460 |
| 2016 | $462 | $5,270 | $1,050 | $4,220 |
| 2015 | $485 | $4,550 | $910 | $3,640 |
Source: Public Records
Map
Nearby Homes
- 11416 N 113th Ave
- 11419 N 113th Dr
- 11348 N 113th Dr
- 11111 W Hollywood Ave
- 11024 N 114th Ave
- 11407 N 111th Ave
- 11421 W Lakeshore Dr
- 11118 W Missouri Ave
- 11505 W Kansas Ave
- 11222 W Connecticut Ave
- 11202 N Madison Dr
- 11815 N 112th Dr
- 12005 N 113th Ave
- 12010 N 113th Ave
- 10939 W Sun City Blvd
- 11505 W Ohio Ave
- 11007 W Florida Ave
- 10816 N Madison Dr
- 11220 N 109th Ave
- 11002 W Greer Ave
- 11392 N 113th Ave
- 11384 N 113th Ave
- 11387 N 113th Dr
- 11396 N 113th Ave
- 11380 N 113th Ave
- 11391 N 113th Dr
- 11383 N 113th Dr
- 11387 N 113th Ave
- 11391 N 113th Ave
- 11383 N 113th Ave
- 11395 N 113th Dr
- 11379 N 113th Dr
- 11400 N 113th Ave
- 11302 W Greer Ave
- 11395 N 113th Ave
- 11379 N 113th Ave
- 11399 N 113th Dr
- 11399 N 113th Ave
- 11377 N 113th Ave
- 11404 N 113th Ave