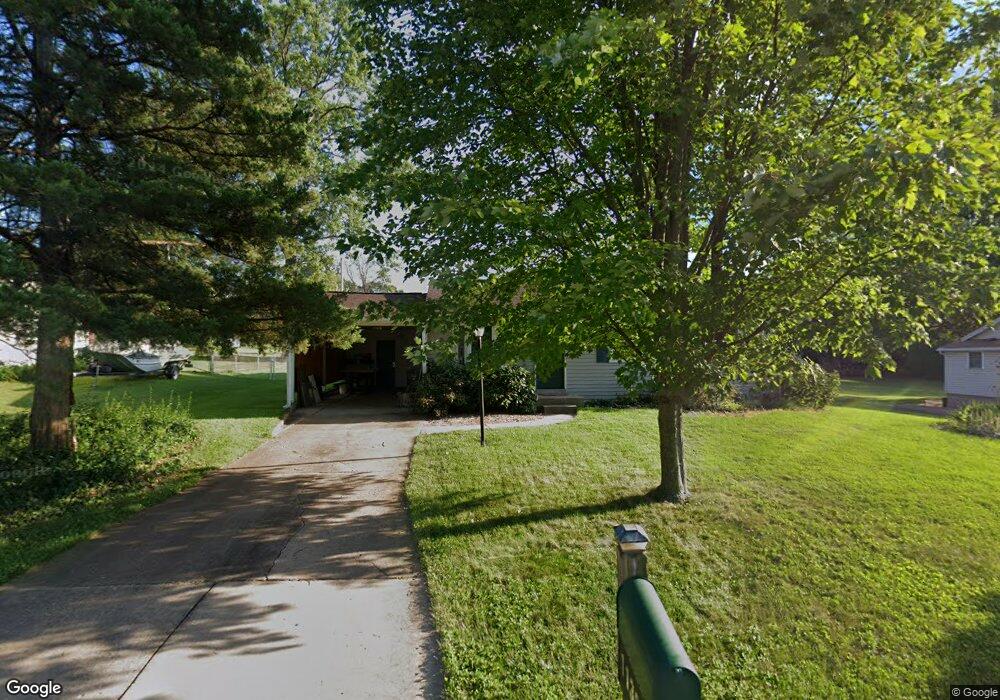
11388 Revere Ln Saint Louis, MO 63128
Estimated Value: $212,114 - $268,000
3
Beds
1
Bath
925
Sq Ft
$255/Sq Ft
Est. Value
About This Home
This home is located at 11388 Revere Ln, Saint Louis, MO 63128 and is currently estimated at $236,279, approximately $255 per square foot. 11388 Revere Ln is a home located in St. Louis County with nearby schools including Sappington Elementary School, Sperreng Middle School, and Lindbergh High School.
Ownership History
Date
Name
Owned For
Owner Type
Purchase Details
Closed on
Jul 14, 2003
Sold by
Truemper Steven T and Newcomb Cynthia J
Bought by
Truemper Steven T and Truemper Cynthia J
Current Estimated Value
Home Financials for this Owner
Home Financials are based on the most recent Mortgage that was taken out on this home.
Original Mortgage
$91,878
Outstanding Balance
$38,856
Interest Rate
5.19%
Mortgage Type
Purchase Money Mortgage
Estimated Equity
$197,423
Purchase Details
Closed on
Apr 13, 2001
Sold by
Allen Wilma J
Bought by
Truemper Steven T and Newcomb Cynthia J
Home Financials for this Owner
Home Financials are based on the most recent Mortgage that was taken out on this home.
Original Mortgage
$91,675
Interest Rate
6.93%
Purchase Details
Closed on
Apr 13, 1999
Sold by
Wilma Allen
Bought by
Allen Wilma J and Wilma J Allen Revocable Living Trust
Create a Home Valuation Report for This Property
The Home Valuation Report is an in-depth analysis detailing your home's value as well as a comparison with similar homes in the area
Home Values in the Area
Average Home Value in this Area
Purchase History
| Date | Buyer | Sale Price | Title Company |
|---|---|---|---|
| Truemper Steven T | -- | -- | |
| Truemper Steven T | $96,500 | -- | |
| Truemper Steven T | -- | -- | |
| Allen Wilma J | -- | -- |
Source: Public Records
Mortgage History
| Date | Status | Borrower | Loan Amount |
|---|---|---|---|
| Open | Truemper Steven T | $91,878 | |
| Closed | Truemper Steven T | $91,675 |
Source: Public Records
Tax History Compared to Growth
Tax History
| Year | Tax Paid | Tax Assessment Tax Assessment Total Assessment is a certain percentage of the fair market value that is determined by local assessors to be the total taxable value of land and additions on the property. | Land | Improvement |
|---|---|---|---|---|
| 2025 | $2,379 | $42,070 | $24,190 | $17,880 |
| 2024 | $2,379 | $36,080 | $20,140 | $15,940 |
| 2023 | $2,379 | $36,080 | $20,140 | $15,940 |
| 2022 | $2,446 | $33,060 | $20,140 | $12,920 |
| 2021 | $2,168 | $33,060 | $20,140 | $12,920 |
| 2020 | $1,881 | $27,620 | $17,590 | $10,030 |
| 2019 | $1,876 | $27,620 | $17,590 | $10,030 |
| 2018 | $1,975 | $26,470 | $9,460 | $17,010 |
| 2017 | $1,954 | $26,470 | $9,460 | $17,010 |
| 2016 | $1,576 | $20,210 | $8,510 | $11,700 |
| 2015 | $1,583 | $20,210 | $8,510 | $11,700 |
| 2014 | $1,522 | $19,230 | $7,180 | $12,050 |
Source: Public Records
Map
Nearby Homes
- 11345 Revere Ln
- 5837 Oak Forest Ln
- 25 Fawnwood Dr
- 10916 Arctic Dr
- 11673 Rossmoor Ln
- 11074 Kohrs Ln
- 10923 Suanis Ct
- 4849 Gatesbury Dr
- 11862 E Concord Rd
- 4838 Dorsie Dr
- 4740 Hedgemont Dr
- 9932 Jan Dr
- 9511 Alix Dr
- 4931 Theiss Rd
- 11542 Concord Village Ave
- 12015 Charwick Dr
- 9201 Cedarberry Ct
- 12055 Charwick Dr
- 10115 Fite Cir
- 4449 Pinyon Jay Ct
- 11386 Revere Ln
- 11394 Revere Ln
- 4649 Concord Oaks Dr
- 4643 Concord Oaks Dr
- 4655 Concord Oaks Dr
- 11387 Revere Ln
- 11384 Revere Ln
- 4637 Concord Oaks Dr
- 11393 Revere Ln
- 11380 Revere Ln
- 11373 Revere Ln
- 4101 Concord Oaks Dr
- 4650 Concord Oaks Dr
- 11374 Ranger Dr
- 11376 Revere Ln
- 4642 Concord Oaks Dr
- 4631 Concord Oaks Dr
- 11369 Revere Ln
- 4109 Concord Oaks Dr
- 11370 Ranger Dr