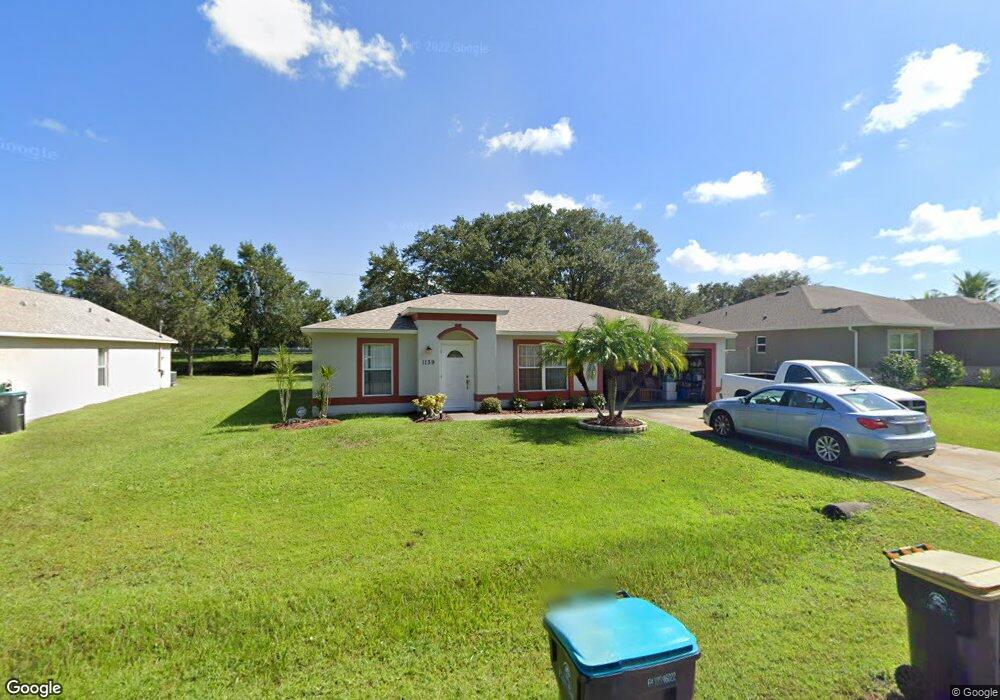
1139 Cordova St SE Palm Bay, FL 32909
Estimated Value: $266,181 - $354,000
4
Beds
2
Baths
1,384
Sq Ft
$213/Sq Ft
Est. Value
About This Home
This home is located at 1139 Cordova St SE, Palm Bay, FL 32909 and is currently estimated at $295,045, approximately $213 per square foot. 1139 Cordova St SE is a home located in Brevard County with nearby schools including John F. Turner Sr. Elementary School, Southwest Middle School, and Palm Bay Magnet Senior High School.
Ownership History
Date
Name
Owned For
Owner Type
Purchase Details
Closed on
Jan 18, 2002
Sold by
Housing & Urban Dev Wa Dc
Bought by
Defelice Michael A and Defelice Karen T
Current Estimated Value
Home Financials for this Owner
Home Financials are based on the most recent Mortgage that was taken out on this home.
Original Mortgage
$75,404
Outstanding Balance
$30,901
Interest Rate
7.08%
Estimated Equity
$264,144
Purchase Details
Closed on
Mar 28, 2001
Sold by
Clerk Circuit Court
Bought by
Leader Mtg Co
Purchase Details
Closed on
Mar 16, 2001
Sold by
Leader Mtg Co
Bought by
Housing & Urban Dev
Purchase Details
Closed on
Oct 6, 1997
Sold by
Mercedes Homes Inc
Bought by
Johnson Sibyl D
Home Financials for this Owner
Home Financials are based on the most recent Mortgage that was taken out on this home.
Original Mortgage
$67,714
Interest Rate
7.6%
Purchase Details
Closed on
Jul 30, 1997
Sold by
Wencel Eileen B
Bought by
Mercedes Homes Inc
Create a Home Valuation Report for This Property
The Home Valuation Report is an in-depth analysis detailing your home's value as well as a comparison with similar homes in the area
Home Values in the Area
Average Home Value in this Area
Purchase History
| Date | Buyer | Sale Price | Title Company |
|---|---|---|---|
| Defelice Michael A | $77,800 | -- | |
| Leader Mtg Co | -- | -- | |
| Housing & Urban Dev | -- | -- | |
| Johnson Sibyl D | $80,700 | -- | |
| Mercedes Homes Inc | $4,000 | -- |
Source: Public Records
Mortgage History
| Date | Status | Borrower | Loan Amount |
|---|---|---|---|
| Open | Defelice Michael A | $75,404 | |
| Previous Owner | Johnson Sibyl D | $67,714 |
Source: Public Records
Tax History Compared to Growth
Tax History
| Year | Tax Paid | Tax Assessment Tax Assessment Total Assessment is a certain percentage of the fair market value that is determined by local assessors to be the total taxable value of land and additions on the property. | Land | Improvement |
|---|---|---|---|---|
| 2025 | $674 | $71,590 | -- | -- |
| 2024 | $666 | $69,580 | -- | -- |
| 2023 | $666 | $67,560 | $0 | $0 |
| 2022 | $640 | $65,600 | $0 | $0 |
| 2021 | $659 | $63,690 | $0 | $0 |
| 2020 | $654 | $62,820 | $0 | $0 |
| 2019 | $814 | $61,410 | $0 | $0 |
| 2018 | $810 | $60,270 | $0 | $0 |
| 2017 | $840 | $59,040 | $0 | $0 |
| 2016 | $673 | $57,830 | $9,000 | $48,830 |
| 2015 | $687 | $57,430 | $9,000 | $48,430 |
| 2014 | $694 | $56,980 | $6,500 | $50,480 |
Source: Public Records
Map
Nearby Homes
- 283 Fluvia Ave SE
- 1015 Durango St SE
- 1050 Douglas St SE
- 0 Malabar Rd SE
- Plan 1755 at Palm Bay
- Plan 1540 at Palm Bay
- Plan 2265 at Palm Bay
- Plan 2117 at Palm Bay
- Plan 2430 at Palm Bay
- 37 San Filippo Dr SE
- 1240 Malabar Rd
- 1250 Green Ct
- 951 Hosbine St SE
- Princess Plan at Richmond Cove
- Sugar Palm Plan at Richmond Cove
- Sabal Plan at Richmond Cove
- Silver Palm Plan at Richmond Cove
- Indigo Plan at Richmond Cove
- Palmetto Plan at Richmond Cove
- Royal Plan at Richmond Cove
- 1151 Cordova St SE
- 1127 Cordova St SE
- 00 Cordova St SE
- 0 SE Cordova St Unit 952898
- 1115 Cordova St SE Unit 9
- 1115 Cordova St SE
- 1163 Cordova St SE
- 1098 Durango St SE
- 1162 Cordova St SE
- 1103 Cordova St SE
- 1092 Cordova St SE
- 1174 Cordova St SE
- 284 Fluvia Ave SE
- 1071 Durango St SE
- 272 Fluvia Ave SE
- 1084 Durango St SE
- 1179 Cordova St SE
- 1091 Cordova St SE
- 1186 Cordova St SE
- 0000 Emerald Rd SE