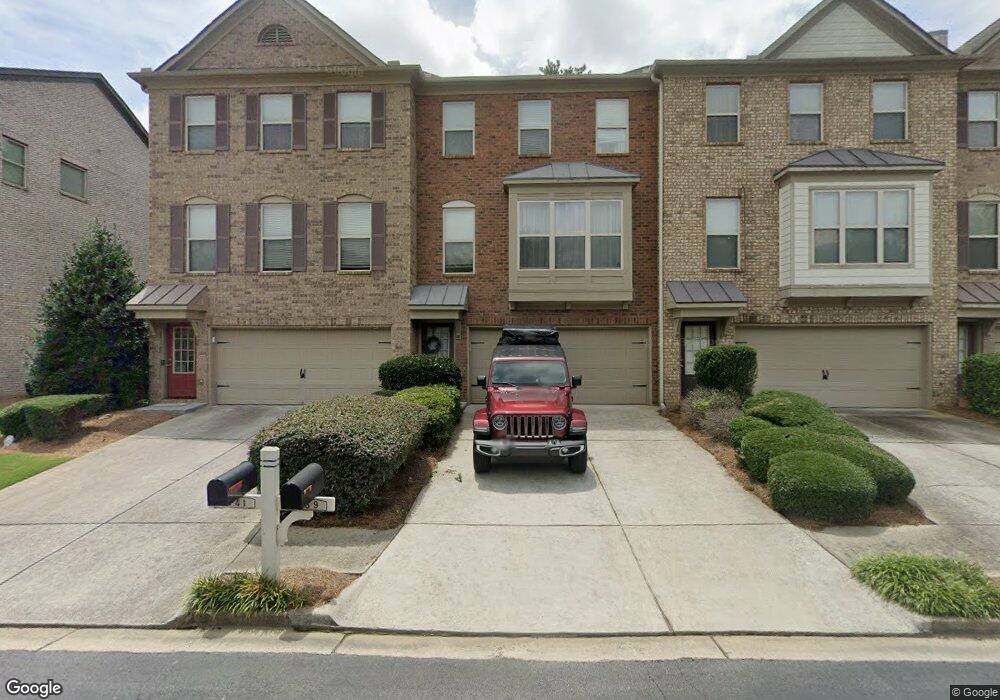
1139 Laurel Valley Ct Unit 66 Buford, GA 30519
Estimated Value: $394,000 - $407,000
3
Beds
4
Baths
1,929
Sq Ft
$208/Sq Ft
Est. Value
About This Home
This home is located at 1139 Laurel Valley Ct Unit 66, Buford, GA 30519 and is currently estimated at $400,490, approximately $207 per square foot. 1139 Laurel Valley Ct Unit 66 is a home located in Gwinnett County with nearby schools including Rock Springs Elementary School, Creekland Middle School, and Collins Hill High School.
Ownership History
Date
Name
Owned For
Owner Type
Purchase Details
Closed on
Feb 28, 2017
Sold by
Brickner Susan Tucker
Bought by
Colby Meghan E
Current Estimated Value
Home Financials for this Owner
Home Financials are based on the most recent Mortgage that was taken out on this home.
Original Mortgage
$209,407
Outstanding Balance
$172,914
Interest Rate
4.19%
Mortgage Type
VA
Estimated Equity
$227,576
Purchase Details
Closed on
Jul 25, 2014
Sold by
Glaser Marianne J
Bought by
Brickner Susan Tucker
Home Financials for this Owner
Home Financials are based on the most recent Mortgage that was taken out on this home.
Original Mortgage
$173,375
Interest Rate
4.19%
Mortgage Type
New Conventional
Purchase Details
Closed on
Jan 23, 2009
Sold by
Equity Rsrc Ptrs-Thomas Llc
Bought by
Glaser Marianne J
Home Financials for this Owner
Home Financials are based on the most recent Mortgage that was taken out on this home.
Original Mortgage
$87,100
Interest Rate
5.23%
Mortgage Type
Stand Alone Second
Create a Home Valuation Report for This Property
The Home Valuation Report is an in-depth analysis detailing your home's value as well as a comparison with similar homes in the area
Home Values in the Area
Average Home Value in this Area
Purchase History
| Date | Buyer | Sale Price | Title Company |
|---|---|---|---|
| Colby Meghan E | $205,000 | -- | |
| Brickner Susan Tucker | $182,500 | -- | |
| Glaser Marianne J | $159,100 | -- |
Source: Public Records
Mortgage History
| Date | Status | Borrower | Loan Amount |
|---|---|---|---|
| Open | Colby Meghan E | $209,407 | |
| Previous Owner | Brickner Susan Tucker | $173,375 | |
| Previous Owner | Glaser Marianne J | $87,100 |
Source: Public Records
Tax History Compared to Growth
Tax History
| Year | Tax Paid | Tax Assessment Tax Assessment Total Assessment is a certain percentage of the fair market value that is determined by local assessors to be the total taxable value of land and additions on the property. | Land | Improvement |
|---|---|---|---|---|
| 2025 | $6,504 | $177,360 | $24,000 | $153,360 |
| 2024 | $6,059 | $162,720 | $26,400 | $136,320 |
| 2023 | $6,059 | $154,680 | $26,400 | $128,280 |
| 2022 | $5,099 | $136,520 | $26,400 | $110,120 |
| 2021 | $4,195 | $109,240 | $18,400 | $90,840 |
| 2020 | $4,039 | $104,280 | $18,400 | $85,880 |
| 2019 | $3,892 | $104,280 | $18,400 | $85,880 |
| 2018 | $3,115 | $82,000 | $18,400 | $63,600 |
| 2016 | $2,606 | $86,640 | $17,440 | $69,200 |
| 2015 | $2,316 | $72,440 | $13,600 | $58,840 |
| 2014 | -- | $49,960 | $12,000 | $37,960 |
Source: Public Records
Map
Nearby Homes
- 1096 Rock Springs Rd
- 2940 Montague Place Dr
- 990 Spring Brook Dr
- 3080 Baymount Dr
- 975 Grace Dr
- 842 Rockfount Way
- 3234 Baymount Way
- 1375 Rock Springs Rd
- 2711 Bluffton Rd
- 2700 Pierce Brennen Ct
- 2769 Springfount Trail
- 2759 Springfount Trail
- 2682 Pierce Brennen Ct NE
- 2743 Pierce Brennen Ct NE
- 928 Pierce Ivy Ct
- 1405 Rock Springs Rd
- 1139 Laurel Valley Ct
- 1137 Laurel Valley Trail
- 1137 Laurel Valley Ct Unit 67
- 1137 Laurel Valley Ct
- 1141 Laurel Valley Ct Unit 65
- 1141 Laurel Valley Ct
- 1135 Laurel Valley Ct Unit 68
- 1135 Laurel Valley Ct
- 1143 Laurel Valley Ct Unit 64A
- 1143 Laurel Valley Ct
- 1133 Laurel Valley Ct Unit 69
- 1133 Laurel Valley Ct
- 1133 Laurel Valley Ct
- 1131 Laurel Valley Trail
- 1145 Laurel Valley Ct Unit 63A
- 1145 Laurel Valley Ct
- 1131 Laurel Valley Ct Unit 70
- 1131 Laurel Valley Ct
- 0 Laurel Valley Unit 8660055
- 0 Laurel Valley Unit 8840646