Estimated Value: $141,000 - $206,000
4
Beds
2
Baths
1,570
Sq Ft
$113/Sq Ft
Est. Value
About This Home
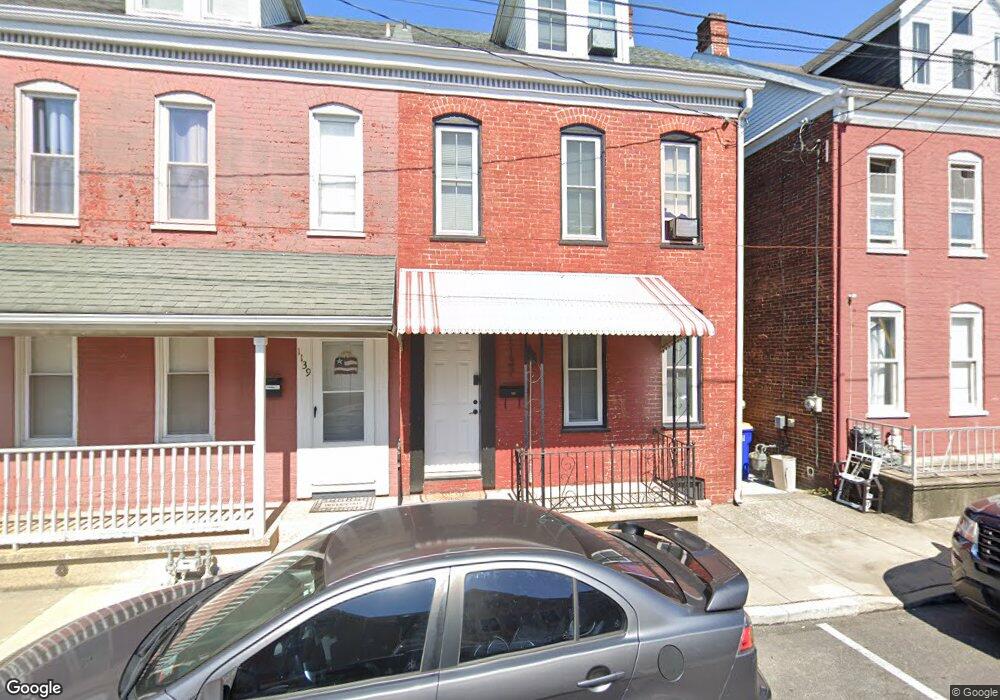
This home is located at 1139 N Duke St, York, PA 17404 and is currently estimated at $177,008, approximately $112 per square foot. 1139 N Duke St is a home located in York County with nearby schools including Central York High School, York Academy Regional Charter Lower School, and Holy Trinity Catholic School.
Ownership History
Date
Name
Owned For
Owner Type
Purchase Details
Closed on
Apr 25, 2008
Sold by
Isz Partnership
Bought by
Waltermyer James S and Mainley Lindsay M
Current Estimated Value
Home Financials for this Owner
Home Financials are based on the most recent Mortgage that was taken out on this home.
Original Mortgage
$115,192
Outstanding Balance
$74,237
Interest Rate
6.22%
Mortgage Type
FHA
Estimated Equity
$102,771
Purchase Details
Closed on
Feb 13, 2006
Sold by
Flagstar Bank Fsb
Bought by
Zimmerman Sheldon D and Zimmerman Zachary B
Purchase Details
Closed on
Jan 10, 2006
Sold by
Knotts Charles and Knotts Charles A
Bought by
Flagstar Bank Fsb
Purchase Details
Closed on
May 11, 2000
Sold by
Chinault Edward E and Chinault Tina M
Bought by
Knott Charles
Home Financials for this Owner
Home Financials are based on the most recent Mortgage that was taken out on this home.
Original Mortgage
$58,400
Interest Rate
9.87%
Create a Home Valuation Report for This Property
The Home Valuation Report is an in-depth analysis detailing your home's value as well as a comparison with similar homes in the area
Home Values in the Area
Average Home Value in this Area
Purchase History
| Date | Buyer | Sale Price | Title Company |
|---|---|---|---|
| Waltermyer James S | $119,250 | None Available | |
| Zimmerman Sheldon D | $46,000 | None Available | |
| Flagstar Bank Fsb | $1,662 | None Available | |
| Knott Charles | $47,000 | -- |
Source: Public Records
Mortgage History
| Date | Status | Borrower | Loan Amount |
|---|---|---|---|
| Open | Waltermyer James S | $115,192 | |
| Previous Owner | Knott Charles | $58,400 |
Source: Public Records
Tax History Compared to Growth
Tax History
| Year | Tax Paid | Tax Assessment Tax Assessment Total Assessment is a certain percentage of the fair market value that is determined by local assessors to be the total taxable value of land and additions on the property. | Land | Improvement |
|---|---|---|---|---|
| 2025 | $2,762 | $73,380 | $21,200 | $52,180 |
| 2024 | $2,698 | $73,380 | $21,200 | $52,180 |
| 2023 | $2,619 | $73,380 | $21,200 | $52,180 |
| 2022 | $2,585 | $73,380 | $21,200 | $52,180 |
| 2021 | $2,512 | $73,380 | $21,200 | $52,180 |
| 2020 | $2,512 | $73,380 | $21,200 | $52,180 |
| 2019 | $2,475 | $73,380 | $21,200 | $52,180 |
| 2018 | $2,433 | $73,380 | $21,200 | $52,180 |
| 2017 | $2,401 | $73,380 | $21,200 | $52,180 |
| 2016 | $0 | $73,380 | $21,200 | $52,180 |
| 2015 | -- | $73,380 | $21,200 | $52,180 |
| 2014 | -- | $73,380 | $21,200 | $52,180 |
Source: Public Records
Map
Nearby Homes
- 1118 N George St
- 1015 N Duke St
- 1360 Breezeview Dr
- 633 N George St
- 623 N George St
- 110 Taft Ave
- 536 N Beaver St
- 529 Thomas St
- 1221 Continental Rd
- 712 Kelly Dr
- 1327 Ben Hogan Way
- 560 N Pershing Ave
- 1355 Ben Hogan Way
- 540 N Pershing Ave
- 538 N Pershing Ave
- 102 Lightner Rd
- 130 Lightner Rd
- 652 Windsor St
- 2345 N Point Dr
- 634 N Franklin St