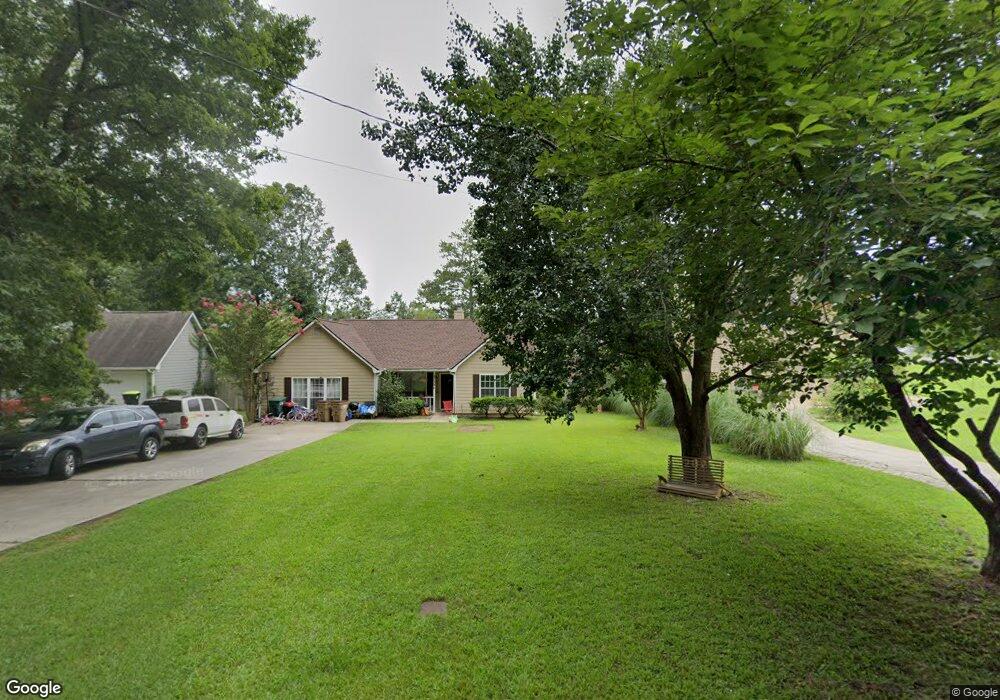
1139 Orr Rd Jonesboro, GA 30238
Estimated Value: $232,465 - $288,000
3
Beds
2
Baths
1,700
Sq Ft
$150/Sq Ft
Est. Value
About This Home
This home is located at 1139 Orr Rd, Jonesboro, GA 30238 and is currently estimated at $255,366, approximately $150 per square foot. 1139 Orr Rd is a home located in Clayton County with nearby schools including Kemp Primary School, Kemp Elementary School, and Mundys Mill Middle School.
Ownership History
Date
Name
Owned For
Owner Type
Purchase Details
Closed on
Nov 20, 2002
Sold by
Connolly Ryan C and Connolly Rene A
Bought by
Scott Amanda J
Current Estimated Value
Home Financials for this Owner
Home Financials are based on the most recent Mortgage that was taken out on this home.
Original Mortgage
$117,050
Interest Rate
5.99%
Mortgage Type
FHA
Purchase Details
Closed on
Feb 5, 2002
Sold by
Connolly Ryan A
Bought by
Connolly Ryan C and Connolly Rene A
Home Financials for this Owner
Home Financials are based on the most recent Mortgage that was taken out on this home.
Original Mortgage
$107,000
Interest Rate
4%
Mortgage Type
New Conventional
Purchase Details
Closed on
May 10, 2000
Sold by
Kitchens Joe L
Bought by
Connolly Ryan C and Connolly Rene A
Home Financials for this Owner
Home Financials are based on the most recent Mortgage that was taken out on this home.
Original Mortgage
$107,600
Interest Rate
8.14%
Mortgage Type
FHA
Create a Home Valuation Report for This Property
The Home Valuation Report is an in-depth analysis detailing your home's value as well as a comparison with similar homes in the area
Home Values in the Area
Average Home Value in this Area
Purchase History
| Date | Buyer | Sale Price | Title Company |
|---|---|---|---|
| Scott Amanda J | $119,000 | -- | |
| Connolly Ryan C | -- | -- | |
| Connolly Ryan C | $107,700 | -- |
Source: Public Records
Mortgage History
| Date | Status | Borrower | Loan Amount |
|---|---|---|---|
| Previous Owner | Scott Amanda J | $117,050 | |
| Previous Owner | Connolly Ryan C | $107,000 | |
| Previous Owner | Connolly Ryan C | $107,600 |
Source: Public Records
Tax History Compared to Growth
Tax History
| Year | Tax Paid | Tax Assessment Tax Assessment Total Assessment is a certain percentage of the fair market value that is determined by local assessors to be the total taxable value of land and additions on the property. | Land | Improvement |
|---|---|---|---|---|
| 2024 | $2,700 | $79,200 | $7,200 | $72,000 |
| 2023 | $2,666 | $73,840 | $7,200 | $66,640 |
| 2022 | $2,292 | $68,400 | $7,200 | $61,200 |
| 2021 | $1,523 | $48,560 | $7,200 | $41,360 |
| 2020 | $1,537 | $48,423 | $7,200 | $41,223 |
| 2019 | $1,547 | $48,103 | $6,400 | $41,703 |
| 2018 | $1,444 | $45,566 | $6,400 | $39,166 |
| 2017 | $1,597 | $49,239 | $6,400 | $42,839 |
| 2016 | $1,412 | $44,706 | $6,400 | $38,306 |
| 2015 | $1,577 | $0 | $0 | $0 |
| 2014 | $1,248 | $41,370 | $5,600 | $35,770 |
Source: Public Records
Map
Nearby Homes
- 1131 Orr Rd
- 1157 Mundys Mill Rd
- 9744 Carolina Dr
- 6632 Chason Woods Ct
- 6637 Chason Woods Ct
- 6648 Coker Way
- 9620 Carolina Dr
- 9531 Winding Way Ln
- 1358 Riverstone Rd Unit 102
- 9468 Briarwood Ln
- 1506 Mundys Mill Rd
- 1256 Riverstone Rd
- 1274 Riverstone Rd
- 1352 Riverstone Rd Unit 104
- 1364 Riverstone Rd Unit 99
- 1366 Riverstone Rd Unit 98
- 1362 Riverstone Rd Unit LOT 100
- 1360 Riverstone Rd Unit LOT 101
- 1262 Riverstone Rd
- 1234 Riverstone Rd
- 1147 Orr Rd
- 0 Orr Rd Unit 3269832
- 0 Orr Rd
- 1175 Mundys Mill Rd
- 1175 Mundys Mill Rd Unit 38
- 1155 Orr Rd
- 1172 Owen Ct Unit 1
- 1163 Orr Rd
- 1165 Mundys Mill Rd
- 1165 Mundys Mill Rd
- 1177 Owen Ct
- 1164 Owen Ct
- 9733 Washington Cir Unit 1
- 9729 Washington Cir Unit 2
- 1171 Orr Rd
- 9737 Washington Cir
- 1169 Owen Ct Unit 208D
- 1169 Owen Ct
- 9741 Washington Cir
- 1179 Orr Rd