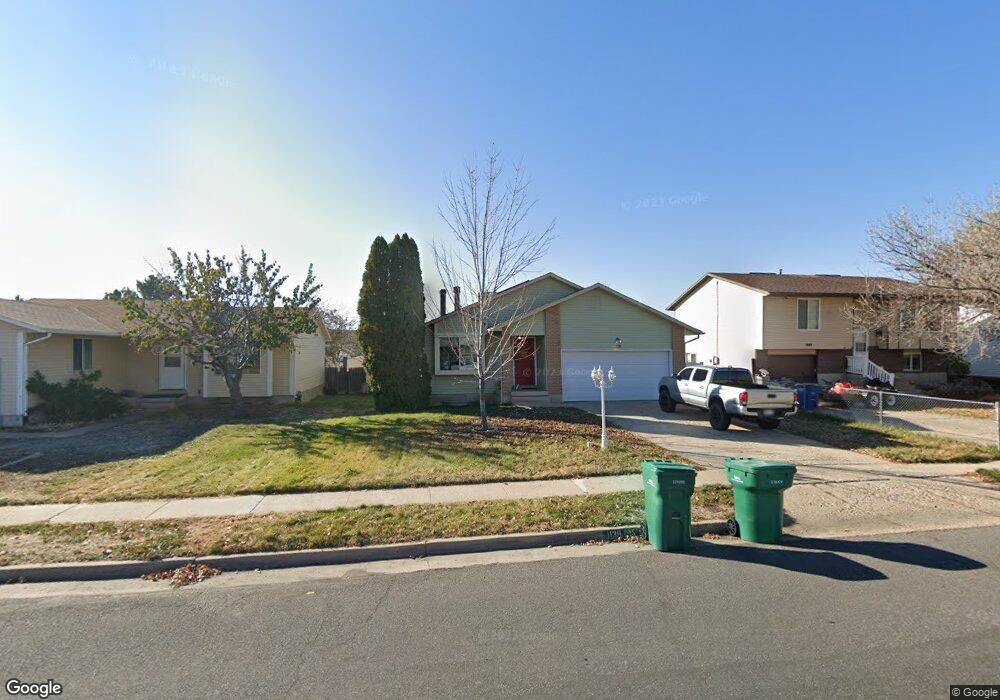
1139 W 2450 N Layton, UT 84041
Estimated Value: $436,000 - $455,032
4
Beds
2
Baths
2,170
Sq Ft
$205/Sq Ft
Est. Value
About This Home
This home is located at 1139 W 2450 N, Layton, UT 84041 and is currently estimated at $445,508, approximately $205 per square foot. 1139 W 2450 N is a home located in Davis County with nearby schools including Lincoln Elementary School, North Layton Junior High School, and Northridge High School.
Ownership History
Date
Name
Owned For
Owner Type
Purchase Details
Closed on
Nov 20, 2020
Sold by
Stuart George E
Bought by
Stuart George E and Stuart Skye L
Current Estimated Value
Purchase Details
Closed on
Mar 11, 2008
Sold by
Monson Eric J
Bought by
Monson Eric J and Monson Amy L
Home Financials for this Owner
Home Financials are based on the most recent Mortgage that was taken out on this home.
Original Mortgage
$155,924
Interest Rate
5.65%
Mortgage Type
New Conventional
Purchase Details
Closed on
Aug 29, 2006
Sold by
Cutler Royce and Cutler Ronalyn
Bought by
Monson Eric J
Home Financials for this Owner
Home Financials are based on the most recent Mortgage that was taken out on this home.
Original Mortgage
$157,325
Interest Rate
6.67%
Mortgage Type
FHA
Purchase Details
Closed on
Dec 4, 2002
Sold by
Best Andrew E
Bought by
Best Margaret N
Purchase Details
Closed on
Nov 13, 2002
Sold by
Best Andrew E
Bought by
Best Margaret N
Create a Home Valuation Report for This Property
The Home Valuation Report is an in-depth analysis detailing your home's value as well as a comparison with similar homes in the area
Home Values in the Area
Average Home Value in this Area
Purchase History
| Date | Buyer | Sale Price | Title Company |
|---|---|---|---|
| Stuart George E | -- | Pinnacle Title Ins A | |
| Monson Eric J | -- | Inwest Title Services Inc | |
| Monson Eric J | -- | Integrated Title Insurance | |
| Best Margaret N | -- | -- | |
| Best Margaret N | -- | -- |
Source: Public Records
Mortgage History
| Date | Status | Borrower | Loan Amount |
|---|---|---|---|
| Closed | Monson Eric J | $155,924 | |
| Closed | Monson Eric J | $157,325 |
Source: Public Records
Tax History Compared to Growth
Tax History
| Year | Tax Paid | Tax Assessment Tax Assessment Total Assessment is a certain percentage of the fair market value that is determined by local assessors to be the total taxable value of land and additions on the property. | Land | Improvement |
|---|---|---|---|---|
| 2024 | $2,070 | $218,900 | $110,758 | $108,142 |
| 2023 | $2,087 | $389,000 | $135,679 | $253,321 |
| 2022 | $1,934 | $218,900 | $70,534 | $148,366 |
| 2021 | $1,934 | $292,000 | $95,836 | $196,164 |
| 2020 | $1,754 | $254,000 | $81,934 | $172,066 |
| 2019 | $1,763 | $250,000 | $79,017 | $170,983 |
| 2018 | $1,580 | $225,000 | $79,017 | $145,983 |
| 2016 | $1,413 | $103,785 | $24,401 | $79,384 |
| 2015 | $1,322 | $92,180 | $24,401 | $67,779 |
| 2014 | $1,285 | $91,647 | $24,401 | $67,246 |
| 2013 | -- | $84,012 | $20,680 | $63,332 |
Source: Public Records
Map
Nearby Homes
- 2402 N 725 W
- 2887 N 1175 W
- 2378 N 675 W
- 781 W 2150 N
- 2949 N 1175 W
- 850 S 1650 E Unit D
- 1548 E 925 S
- 2211 N 525 W
- 709 W Highway 193
- 1606 W 1960 N
- 2187 N 450 W
- 1665 W 1960 N
- 2875 N Hill Field Rd Unit 58
- 2875 N Hill Field Rd Unit 17
- 2875 N Hill Field Rd Unit 62
- 1208 Valhalla Dr
- 1900 N 1690 W
- 1094 N Angel St W
- 1413 W 1650 N
- 65 Sunset Dr