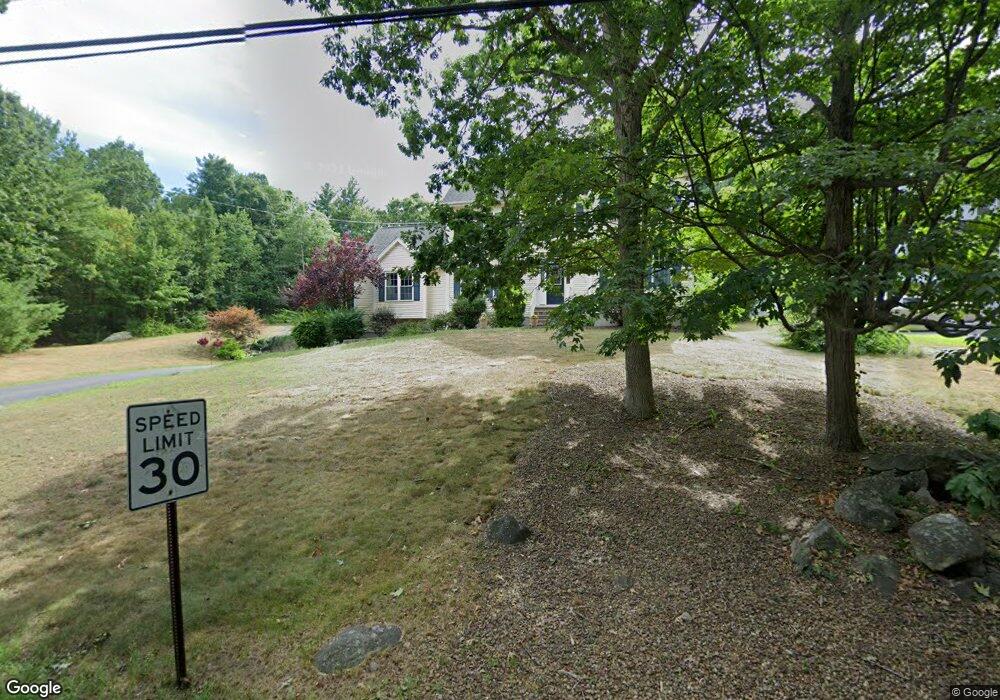
113A West St Medway, MA 02053
Estimated Value: $863,403 - $1,083,000
4
Beds
3
Baths
2,956
Sq Ft
$329/Sq Ft
Est. Value
About This Home
This home is located at 113A West St, Medway, MA 02053 and is currently estimated at $972,351, approximately $328 per square foot. 113A West St is a home located in Norfolk County with nearby schools including John D. McGovern Elementary School, Burke-Memorial Elementary, and Medway Middle School.
Ownership History
Date
Name
Owned For
Owner Type
Purchase Details
Closed on
Jun 1, 2005
Sold by
Leland Custom Homes In
Bought by
Aghgolian Farah and Aghgolian Matt
Current Estimated Value
Home Financials for this Owner
Home Financials are based on the most recent Mortgage that was taken out on this home.
Original Mortgage
$516,080
Outstanding Balance
$270,638
Interest Rate
5.83%
Mortgage Type
Purchase Money Mortgage
Estimated Equity
$701,713
Create a Home Valuation Report for This Property
The Home Valuation Report is an in-depth analysis detailing your home's value as well as a comparison with similar homes in the area
Home Values in the Area
Average Home Value in this Area
Purchase History
| Date | Buyer | Sale Price | Title Company |
|---|---|---|---|
| Aghgolian Farah | $645,100 | -- |
Source: Public Records
Mortgage History
| Date | Status | Borrower | Loan Amount |
|---|---|---|---|
| Open | Aghgolian Farah | $516,080 |
Source: Public Records
Tax History Compared to Growth
Tax History
| Year | Tax Paid | Tax Assessment Tax Assessment Total Assessment is a certain percentage of the fair market value that is determined by local assessors to be the total taxable value of land and additions on the property. | Land | Improvement |
|---|---|---|---|---|
| 2025 | $10,740 | $753,700 | $269,800 | $483,900 |
| 2024 | $10,853 | $753,700 | $269,800 | $483,900 |
| 2023 | $10,461 | $656,300 | $232,500 | $423,800 |
| 2022 | $10,493 | $619,800 | $207,600 | $412,200 |
| 2021 | $9,505 | $544,400 | $186,800 | $357,600 |
| 2020 | $8,656 | $494,600 | $166,100 | $328,500 |
| 2019 | $8,597 | $506,600 | $182,700 | $323,900 |
| 2018 | $8,360 | $473,400 | $157,700 | $315,700 |
| 2017 | $8,385 | $467,900 | $157,700 | $310,200 |
| 2016 | $8,144 | $449,700 | $139,500 | $310,200 |
| 2015 | $7,666 | $420,300 | $124,500 | $295,800 |
| 2014 | $7,753 | $411,500 | $132,800 | $278,700 |
Source: Public Records
Map
Nearby Homes
- 6 Rainbow Dr
- 22 Granite St
- 4 Deerfield Rd
- 78 Fisher St
- 85 Fisher St
- 9 Tulip Way
- 39 West St
- 0 Old Log Lane (Farm St) Unit 73416329
- 462 Hartford Ave
- 455 Hartford Ave
- 6 Freedom Trail
- 387 Hartford Ave
- 48 Black Bear Cir Unit 48
- 11 Black Bear Unit 11
- 43 Black Bear Cir Unit 43
- 9 Black Bear Cir Unit 9
- 7 Black Bear Unit 7
- 3 Black Bear Cir Unit 3
- 10 Black Bear Unit 10
- 5 Fales St