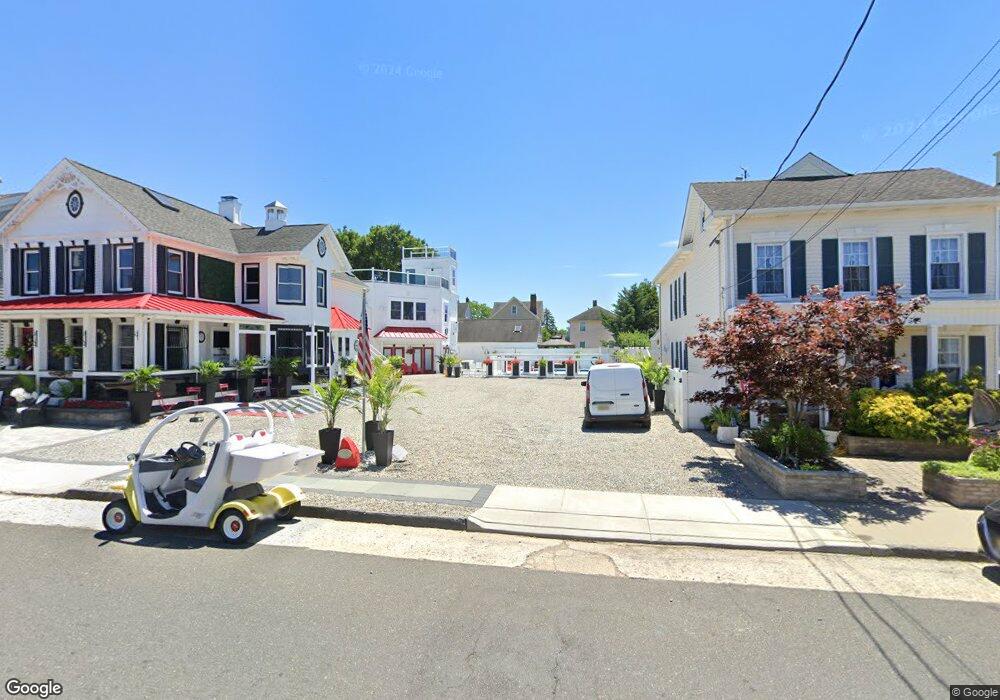
114 1st St Keyport, NJ 07735
Estimated Value: $893,622
3
Beds
--
Bath
1,649
Sq Ft
$542/Sq Ft
Est. Value
About This Home
This home is located at 114 1st St, Keyport, NJ 07735 and is currently priced at $893,622, approximately $541 per square foot. 114 1st St is a home located in Monmouth County with nearby schools including Keyport Central School, Keyport High School, and Icob Academy.
Ownership History
Date
Name
Owned For
Owner Type
Purchase Details
Closed on
Aug 25, 2022
Sold by
114 First Street Llc
Bought by
Merla Joseph
Current Estimated Value
Purchase Details
Closed on
Jul 20, 2018
Sold by
Fleisher Jack and Brown Mauren A
Bought by
114 First St Llc
Home Financials for this Owner
Home Financials are based on the most recent Mortgage that was taken out on this home.
Original Mortgage
$160,000
Interest Rate
4.5%
Mortgage Type
New Conventional
Purchase Details
Closed on
Sep 11, 1985
Bought by
Fleischer Jack and Croom Maureen
Create a Home Valuation Report for This Property
The Home Valuation Report is an in-depth analysis detailing your home's value as well as a comparison with similar homes in the area
Home Values in the Area
Average Home Value in this Area
Purchase History
| Date | Buyer | Sale Price | Title Company |
|---|---|---|---|
| Merla Joseph | -- | -- | |
| 114 First St Llc | $200,000 | All Ahead Title Agency | |
| Fleischer Jack | $87,000 | -- |
Source: Public Records
Mortgage History
| Date | Status | Borrower | Loan Amount |
|---|---|---|---|
| Previous Owner | 114 First St Llc | $160,000 |
Source: Public Records
Tax History Compared to Growth
Tax History
| Year | Tax Paid | Tax Assessment Tax Assessment Total Assessment is a certain percentage of the fair market value that is determined by local assessors to be the total taxable value of land and additions on the property. | Land | Improvement |
|---|---|---|---|---|
| 2022 | $3,115 | $133,300 | $133,300 | $0 |
| 2021 | $3,115 | $123,400 | $123,400 | $0 |
| 2020 | $6,764 | $266,000 | $118,700 | $147,300 |
| 2019 | $7,856 | $309,400 | $114,200 | $195,200 |
| 2018 | $7,402 | $284,700 | $102,000 | $182,700 |
| 2017 | $7,466 | $286,400 | $106,000 | $180,400 |
| 2016 | $7,230 | $279,700 | $106,000 | $173,700 |
| 2015 | $6,968 | $268,300 | $97,000 | $171,300 |
| 2014 | $7,204 | $280,100 | $72,000 | $208,100 |
Source: Public Records
Map
Nearby Homes