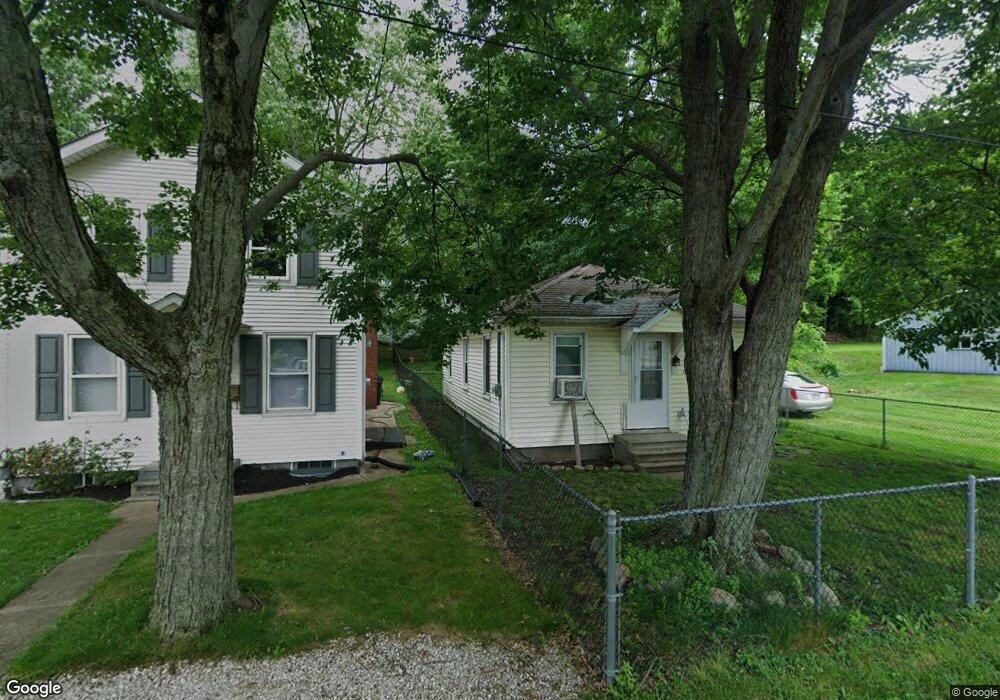
114 2nd St NE Navarre, OH 44662
Estimated Value: $75,178 - $137,000
2
Beds
1
Bath
600
Sq Ft
$177/Sq Ft
Est. Value
About This Home
This home is located at 114 2nd St NE, Navarre, OH 44662 and is currently estimated at $106,045, approximately $176 per square foot. 114 2nd St NE is a home located in Stark County with nearby schools including Fairless Elementary School, Fairless Middle School, and Fairless High School.
Ownership History
Date
Name
Owned For
Owner Type
Purchase Details
Closed on
Oct 3, 2013
Sold by
Coleridge Kim L and Coleridge Patty L
Bought by
Durango Properties Llc
Current Estimated Value
Purchase Details
Closed on
Jul 18, 2006
Sold by
Deutsche Bank National Trust Services
Bought by
Coleridge Kim L and Coleridge Patty L
Purchase Details
Closed on
Jun 6, 2006
Sold by
Knouff Marc A and Knoff Penny S
Bought by
Deutsche Bank National Trust Services
Purchase Details
Closed on
Oct 30, 2001
Sold by
Leolla Seese and Leolla L
Bought by
Knouff Marc A
Home Financials for this Owner
Home Financials are based on the most recent Mortgage that was taken out on this home.
Original Mortgage
$56,000
Interest Rate
8.65%
Mortgage Type
Purchase Money Mortgage
Create a Home Valuation Report for This Property
The Home Valuation Report is an in-depth analysis detailing your home's value as well as a comparison with similar homes in the area
Home Values in the Area
Average Home Value in this Area
Purchase History
| Date | Buyer | Sale Price | Title Company |
|---|---|---|---|
| Durango Properties Llc | -- | None Available | |
| Coleridge Kim L | $23,900 | None Available | |
| Deutsche Bank National Trust Services | $48,000 | None Available | |
| Knouff Marc A | $70,000 | -- |
Source: Public Records
Mortgage History
| Date | Status | Borrower | Loan Amount |
|---|---|---|---|
| Previous Owner | Knouff Marc A | $56,000 | |
| Closed | Knouff Marc A | $14,000 |
Source: Public Records
Tax History Compared to Growth
Tax History
| Year | Tax Paid | Tax Assessment Tax Assessment Total Assessment is a certain percentage of the fair market value that is determined by local assessors to be the total taxable value of land and additions on the property. | Land | Improvement |
|---|---|---|---|---|
| 2025 | -- | $18,690 | $5,040 | $13,650 |
| 2024 | -- | $18,690 | $5,040 | $13,650 |
| 2023 | $758 | $17,020 | $4,030 | $12,990 |
| 2022 | $759 | $17,020 | $4,030 | $12,990 |
| 2021 | $762 | $17,020 | $4,030 | $12,990 |
| 2020 | $602 | $12,640 | $3,190 | $9,450 |
| 2019 | $584 | $12,640 | $3,190 | $9,450 |
| 2018 | $596 | $12,640 | $3,190 | $9,450 |
| 2017 | $510 | $10,300 | $2,560 | $7,740 |
| 2016 | $512 | $10,300 | $2,560 | $7,740 |
| 2015 | $469 | $10,300 | $2,560 | $7,740 |
| 2014 | $504 | $10,370 | $2,560 | $7,810 |
| 2013 | $255 | $10,370 | $2,560 | $7,810 |
Source: Public Records
Map
Nearby Homes
- 112 2nd St NE
- 128 2nd St NE
- 111 Eastern Place NE
- 108 2nd St NE
- 121 Define Ct NE
- 102 2nd St NE
- 320 Tuscarawas St NE
- 109 2nd St NE
- 330 Tuscarawas St NE
- 120 2nd St NE
- 119 2nd St NE
- 305 Market St NE
- 117 Define Ct NE
- 236 Tuscarawas St NE
- 315 Market St NE
- 309 Market St NE
- 228 Tuscarawas St NE
- 215 Market St NE
- 404 Tuscarawas St NE
- 325 Market St NE