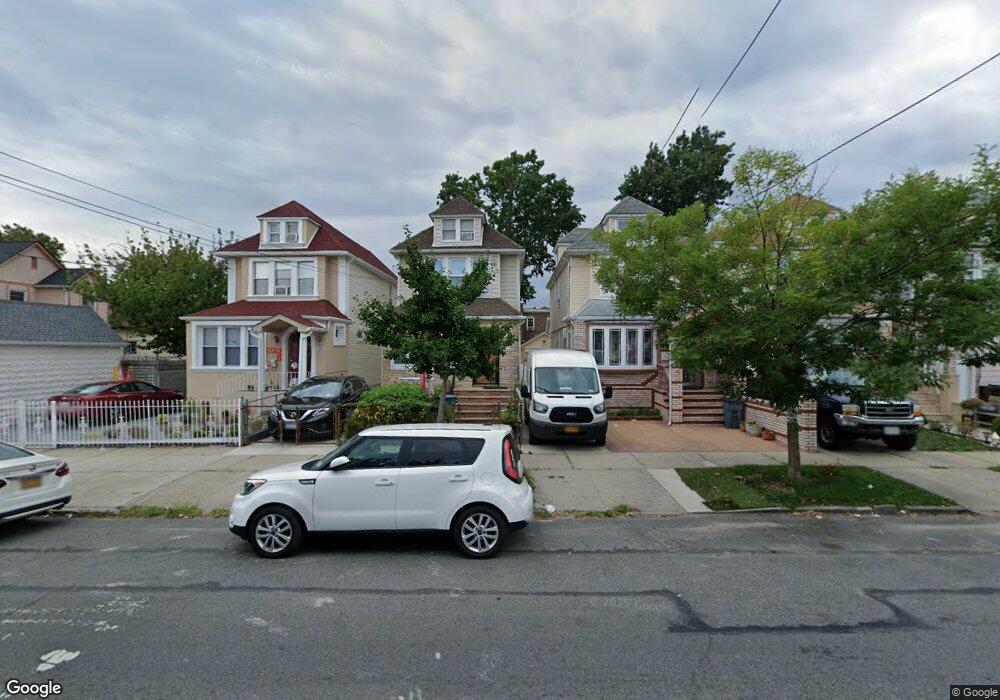
114-46 130th St South Ozone Park, NY 11420
South Ozone Park NeighborhoodEstimated Value: $719,000 - $847,000
4
Beds
2
Baths
1,464
Sq Ft
$537/Sq Ft
Est. Value
About This Home
This home is located at 114-46 130th St, South Ozone Park, NY 11420 and is currently estimated at $786,122, approximately $536 per square foot. 114-46 130th St is a home located in Queens County with nearby schools including P.S. 155, J.H.S. 226 Virgil I. Grisson, and John Adams High School.
Ownership History
Date
Name
Owned For
Owner Type
Purchase Details
Closed on
May 10, 2025
Sold by
Hardeo Hamchan
Bought by
Hardeo Hamchan and Hardeo Sarah
Current Estimated Value
Purchase Details
Closed on
Jun 19, 2018
Sold by
Gadwah Natasha
Bought by
Hardeo Hamchan
Home Financials for this Owner
Home Financials are based on the most recent Mortgage that was taken out on this home.
Original Mortgage
$395,500
Outstanding Balance
$342,094
Interest Rate
4.6%
Mortgage Type
New Conventional
Estimated Equity
$444,028
Purchase Details
Closed on
Sep 18, 2009
Sold by
Clark Leroy and Clark Mark
Bought by
Gadwah Natasha
Home Financials for this Owner
Home Financials are based on the most recent Mortgage that was taken out on this home.
Original Mortgage
$284,800
Interest Rate
5.12%
Mortgage Type
Purchase Money Mortgage
Purchase Details
Closed on
Mar 31, 2006
Sold by
Clark Mark A
Bought by
Clark Leroy E and Clark Mark A
Purchase Details
Closed on
Oct 21, 2005
Sold by
Clark Jeannette and Clark Leroy
Bought by
Clark Mark
Create a Home Valuation Report for This Property
The Home Valuation Report is an in-depth analysis detailing your home's value as well as a comparison with similar homes in the area
Home Values in the Area
Average Home Value in this Area
Purchase History
| Date | Buyer | Sale Price | Title Company |
|---|---|---|---|
| Hardeo Hamchan | -- | -- | |
| Hardeo Hamchan | $565,000 | -- | |
| Hardeo Hamchan | $565,000 | -- | |
| Gadwah Natasha | $356,000 | -- | |
| Gadwah Natasha | $356,000 | -- | |
| Clark Leroy E | -- | -- | |
| Clark Leroy E | -- | -- | |
| Clark Mark | -- | -- | |
| Clark Mark | -- | -- |
Source: Public Records
Mortgage History
| Date | Status | Borrower | Loan Amount |
|---|---|---|---|
| Open | Hardeo Hamchan | $395,500 | |
| Closed | Hardeo Hamchan | $395,500 | |
| Previous Owner | Gadwah Natasha | $284,800 | |
| Closed | Clark Mark | $0 |
Source: Public Records
Tax History Compared to Growth
Tax History
| Year | Tax Paid | Tax Assessment Tax Assessment Total Assessment is a certain percentage of the fair market value that is determined by local assessors to be the total taxable value of land and additions on the property. | Land | Improvement |
|---|---|---|---|---|
| 2025 | $5,526 | $29,129 | $4,886 | $24,243 |
| 2024 | $5,526 | $27,515 | $5,144 | $22,371 |
| 2023 | $5,526 | $27,515 | $5,421 | $22,094 |
| 2022 | $5,229 | $40,800 | $7,920 | $32,880 |
| 2021 | $5,200 | $37,200 | $7,920 | $29,280 |
| 2020 | $5,138 | $33,900 | $7,920 | $25,980 |
| 2019 | $4,797 | $29,040 | $7,920 | $21,120 |
| 2018 | $4,674 | $22,929 | $6,358 | $16,571 |
| 2017 | $4,449 | $21,826 | $6,388 | $15,438 |
| 2016 | $4,117 | $21,826 | $6,388 | $15,438 |
| 2015 | $2,483 | $20,228 | $6,899 | $13,329 |
| 2014 | $2,483 | $19,108 | $7,824 | $11,284 |
Source: Public Records
Map
Nearby Homes
- 114-50 130th St
- 114-29 130th St
- 11455 131st St
- 131-16 115th Ave
- 114-27 127th St
- 115-28 130th St
- 115-15 127th St
- 11444 127th St
- 114-09 127th St
- 11432 127th St
- 11158 128th St
- 111-41 128th St
- 11143 130th St
- 12805 116th Ave
- 128-05 116th Ave
- 115-29 126th St
- 114-33 133rd St
- 124-15 115th Ave
- 116-30 130th St
- 116-27 130th St
- 11428 130th St
- 114-30 130th St Unit 2
- 11428 130th St
- 11430 130th St
- 11426 130th St
- 11434 130th St
- 11424 130th St
- 11436 130th St
- 11422 130th St
- 11438 130th St
- 11418 130th St
- 11440 130th St
- 114-25 130th St
- 11444 130th St
- 11416 130th St
- 11444 130th St
- 11429 130th St
- 11427 130th St
- 11433 130th St
- 11423 130th St