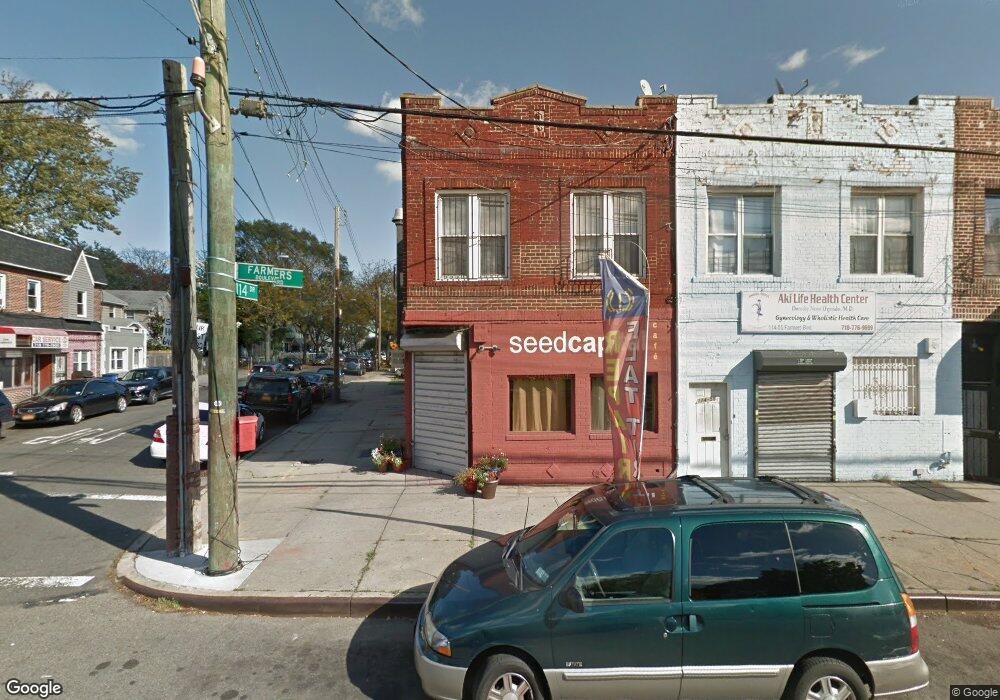
114-53 Farmers Blvd Unit B Jamaica, NY 11412
Saint Albans NeighborhoodEstimated Value: $517,526
--
Bed
--
Bath
2,360
Sq Ft
$219/Sq Ft
Est. Value
About This Home
This home is located at 114-53 Farmers Blvd Unit B, Jamaica, NY 11412 and is currently estimated at $517,526, approximately $219 per square foot. 114-53 Farmers Blvd Unit B is a home located in Queens County with nearby schools including Ps 36 St Albans School and Is 59 Springfield Gardens.
Ownership History
Date
Name
Owned For
Owner Type
Purchase Details
Closed on
Aug 15, 2012
Sold by
Delva Marie Y
Bought by
Creative Solutions Capital Llc
Current Estimated Value
Purchase Details
Closed on
Apr 20, 2007
Sold by
Delva Marie Y and Merilus Joseph
Bought by
Delva Marie Y
Home Financials for this Owner
Home Financials are based on the most recent Mortgage that was taken out on this home.
Original Mortgage
$275,000
Interest Rate
6.21%
Mortgage Type
Commercial
Purchase Details
Closed on
Oct 28, 1999
Sold by
Castor Max and Castor Marie Lourdes
Bought by
Delva Marie Yaniz and Merilus Joseph
Home Financials for this Owner
Home Financials are based on the most recent Mortgage that was taken out on this home.
Original Mortgage
$132,300
Interest Rate
8.11%
Mortgage Type
Commercial
Purchase Details
Closed on
Jan 3, 1995
Sold by
Hunter Edward and Hunter Richard
Bought by
Castor Max and Castor Marie Lourdes
Home Financials for this Owner
Home Financials are based on the most recent Mortgage that was taken out on this home.
Original Mortgage
$60,000
Interest Rate
8.89%
Mortgage Type
Commercial
Create a Home Valuation Report for This Property
The Home Valuation Report is an in-depth analysis detailing your home's value as well as a comparison with similar homes in the area
Home Values in the Area
Average Home Value in this Area
Purchase History
| Date | Buyer | Sale Price | Title Company |
|---|---|---|---|
| Creative Solutions Capital Llc | $290,000 | -- | |
| Creative Solutions Capital Llc | $290,000 | -- | |
| Delva Marie Y | -- | -- | |
| Delva Marie Y | -- | -- | |
| Delva Marie Yaniz | $189,000 | -- | |
| Delva Marie Yaniz | $189,000 | -- | |
| Castor Max | $175,000 | Commonwealth Land Title Ins | |
| Castor Max | $175,000 | Commonwealth Land Title Ins |
Source: Public Records
Mortgage History
| Date | Status | Borrower | Loan Amount |
|---|---|---|---|
| Previous Owner | Delva Marie Y | $275,000 | |
| Previous Owner | Delva Marie Yaniz | $132,300 | |
| Previous Owner | Castor Max | $60,000 | |
| Closed | Castor Max | $50,000 |
Source: Public Records
Tax History Compared to Growth
Tax History
| Year | Tax Paid | Tax Assessment Tax Assessment Total Assessment is a certain percentage of the fair market value that is determined by local assessors to be the total taxable value of land and additions on the property. | Land | Improvement |
|---|---|---|---|---|
| 2025 | $9,233 | $79,761 | $26,220 | $53,541 |
| 2024 | $9,233 | $73,853 | $29,101 | $44,752 |
| 2023 | $8,549 | $68,385 | $25,917 | $42,468 |
| 2022 | $8,367 | $137,250 | $53,550 | $83,700 |
| 2021 | $8,128 | $148,950 | $53,550 | $95,400 |
| 2020 | $7,653 | $148,950 | $53,550 | $95,400 |
| 2019 | $7,165 | $186,300 | $53,550 | $132,750 |
| 2018 | $6,691 | $52,604 | $12,108 | $40,496 |
| 2017 | $6,691 | $52,604 | $12,880 | $39,724 |
| 2016 | $6,571 | $52,604 | $12,880 | $39,724 |
| 2015 | $4,077 | $47,196 | $15,262 | $31,934 |
| 2014 | $4,077 | $43,700 | $16,939 | $26,761 |
Source: Public Records
Map
Nearby Homes
- 191-47 114th Dr
- 191-34 114th Rd
- 191-16 114th Rd
- 191-68 115th Rd
- 194-19 115th Rd
- 19431 114th Rd
- 189-18 114th Dr
- 194-34 115th Rd
- 18908 114th Rd
- 19427 Murdock Ave
- 194-42 Murdock Ave
- 19432 113th Rd
- 19445 Murdock Ave
- 194-56 Murdock Ave
- 18918 Tioga Dr
- 115-72 Farmers Blvd
- 114-22 197th St
- 188-45 Quencer Rd
- 191-40 112th Rd
- 11608 196th St
- 114-53 Farmers Blvd Unit A
- 11453 Farmers Blvd
- 114-55 Farmers Blvd
- 11455 Farmers Blvd
- 114-57 Farmers Blvd
- 11457 Farmers Blvd
- 114-59 Farmers Blvd
- 11459 Farmers Blvd
- 114-43 Farmers Blvd
- 11461 Farmers Blvd
- 11443 Farmers Blvd
- 114-41 Farmers Blvd Unit 1
- 114-41 Farmers Blvd Unit 1
- 114-41 Farmers Blvd Unit 2
- 114-71 Farmers Blvd
- 11463 Farmers Blvd
- 11441 Farmers Blvd
- 191-18 114th Dr
- 11439 Farmers Blvd
- 11465 Farmers Blvd