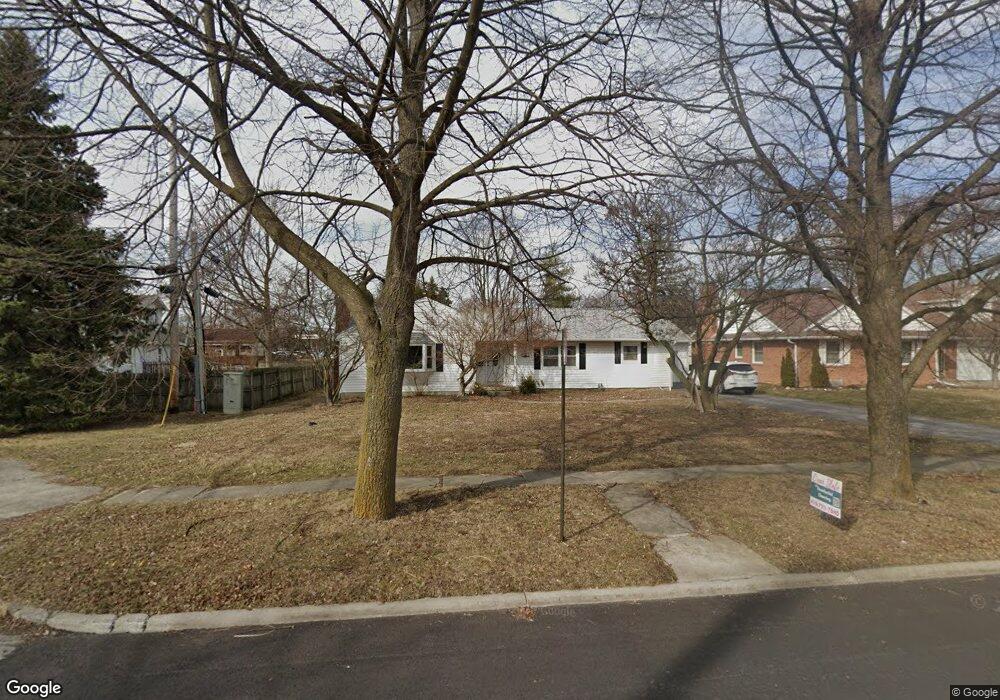
114 7th St Findlay, OH 45840
Estimated Value: $220,462 - $258,000
2
Beds
2
Baths
1,892
Sq Ft
$124/Sq Ft
Est. Value
About This Home
This home is located at 114 7th St, Findlay, OH 45840 and is currently estimated at $235,366, approximately $124 per square foot. 114 7th St is a home located in Hancock County with nearby schools including Jefferson Elementary School, Chamberlin Hill Elementary School, and Donnell Middle School.
Ownership History
Date
Name
Owned For
Owner Type
Purchase Details
Closed on
May 12, 2011
Sold by
The Secretary Of Housing & Urban Develop
Bought by
Douthitt Tamara
Current Estimated Value
Purchase Details
Closed on
Nov 18, 2010
Sold by
Cole Alex C and Cole Alexander C
Bought by
Wells Fargo Bank Na
Purchase Details
Closed on
Sep 23, 2010
Sold by
Wells Fargo Bank Na
Bought by
Secretary Of Housing & Urban Development
Purchase Details
Closed on
Apr 15, 2004
Sold by
Dierksheide Lora J
Bought by
Cole Alexander C and Cole Melissa S
Home Financials for this Owner
Home Financials are based on the most recent Mortgage that was taken out on this home.
Original Mortgage
$130,965
Interest Rate
5.66%
Mortgage Type
FHA
Purchase Details
Closed on
Nov 25, 1998
Sold by
Koehler John
Bought by
Dierksheide Kent
Purchase Details
Closed on
Mar 3, 1987
Bought by
Koehler John H
Purchase Details
Closed on
Aug 19, 1983
Bought by
Jensen David J and Jensen Jacalyn L
Create a Home Valuation Report for This Property
The Home Valuation Report is an in-depth analysis detailing your home's value as well as a comparison with similar homes in the area
Home Values in the Area
Average Home Value in this Area
Purchase History
| Date | Buyer | Sale Price | Title Company |
|---|---|---|---|
| Douthitt Tamara | -- | Attorney | |
| Wells Fargo Bank Na | $68,000 | None Available | |
| Secretary Of Housing & Urban Development | -- | None Available | |
| Cole Alexander C | $132,000 | Whitman Title | |
| Dierksheide Kent | $123,000 | -- | |
| Koehler John H | $63,900 | -- | |
| Jensen David J | $60,000 | -- |
Source: Public Records
Mortgage History
| Date | Status | Borrower | Loan Amount |
|---|---|---|---|
| Previous Owner | Cole Alexander C | $130,965 |
Source: Public Records
Tax History
| Year | Tax Paid | Tax Assessment Tax Assessment Total Assessment is a certain percentage of the fair market value that is determined by local assessors to be the total taxable value of land and additions on the property. | Land | Improvement |
|---|---|---|---|---|
| 2024 | $1,950 | $53,500 | $9,320 | $44,180 |
| 2023 | $1,954 | $53,500 | $9,320 | $44,180 |
| 2022 | $1,947 | $53,500 | $9,320 | $44,180 |
| 2021 | $1,976 | $47,310 | $9,330 | $37,980 |
| 2020 | $1,959 | $46,900 | $9,330 | $37,570 |
| 2019 | $1,920 | $46,900 | $9,330 | $37,570 |
| 2018 | $1,677 | $37,530 | $7,470 | $30,060 |
| 2017 | $1,021 | $37,530 | $7,470 | $30,060 |
| 2016 | $2,570 | $37,530 | $7,470 | $30,060 |
| 2015 | $1,824 | $40,550 | $8,720 | $31,830 |
| 2014 | $1,824 | $40,550 | $8,720 | $31,830 |
| 2012 | $1,839 | $40,550 | $8,720 | $31,830 |
Source: Public Records
Map
Nearby Homes
Your Personal Tour Guide
Ask me questions while you tour the home.