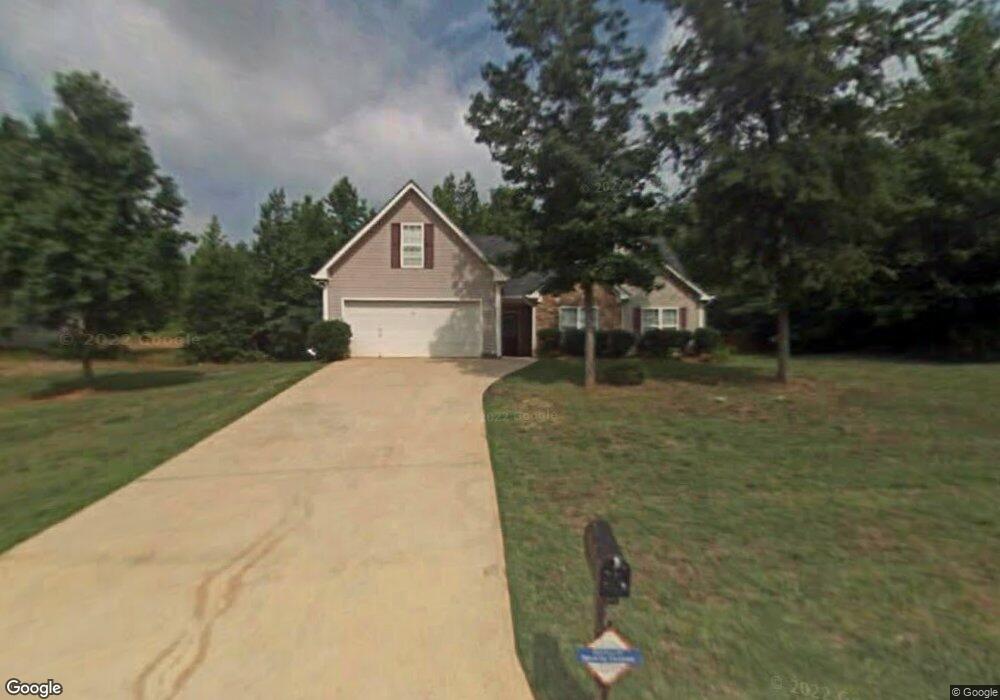
114 Albert Ln Jefferson, GA 30549
Estimated Value: $322,000 - $374,000
3
Beds
2
Baths
1,619
Sq Ft
$211/Sq Ft
Est. Value
About This Home
This home is located at 114 Albert Ln, Jefferson, GA 30549 and is currently estimated at $341,498, approximately $210 per square foot. 114 Albert Ln is a home located in Jackson County with nearby schools including Gum Springs Elementary School, West Jackson Middle School, and Jackson County High School.
Ownership History
Date
Name
Owned For
Owner Type
Purchase Details
Closed on
Aug 3, 2009
Sold by
Reeves Karen Johnson
Bought by
Chastain Harry
Current Estimated Value
Home Financials for this Owner
Home Financials are based on the most recent Mortgage that was taken out on this home.
Original Mortgage
$98,000
Outstanding Balance
$64,059
Interest Rate
5.26%
Mortgage Type
New Conventional
Estimated Equity
$277,439
Purchase Details
Closed on
May 16, 2007
Sold by
Not Provided
Bought by
Chastain Harry
Home Financials for this Owner
Home Financials are based on the most recent Mortgage that was taken out on this home.
Original Mortgage
$124,200
Interest Rate
9.35%
Mortgage Type
New Conventional
Purchase Details
Closed on
Sep 25, 2001
Sold by
Kemp Richard
Bought by
Greg Reidling Group
Purchase Details
Closed on
Jan 24, 2001
Sold by
Kemp Richard C
Bought by
Reidling Greg
Create a Home Valuation Report for This Property
The Home Valuation Report is an in-depth analysis detailing your home's value as well as a comparison with similar homes in the area
Home Values in the Area
Average Home Value in this Area
Purchase History
| Date | Buyer | Sale Price | Title Company |
|---|---|---|---|
| Chastain Harry | $122,500 | -- | |
| Chastain Harry | -- | -- | |
| Greg Reidling Group | -- | -- | |
| Johnson Karen E | $118,500 | -- | |
| Reidling Greg | $26,000 | -- |
Source: Public Records
Mortgage History
| Date | Status | Borrower | Loan Amount |
|---|---|---|---|
| Open | Chastain Harry | $10,000 | |
| Open | Chastain Harry | $98,000 | |
| Previous Owner | Chastain Harry | $124,200 |
Source: Public Records
Tax History Compared to Growth
Tax History
| Year | Tax Paid | Tax Assessment Tax Assessment Total Assessment is a certain percentage of the fair market value that is determined by local assessors to be the total taxable value of land and additions on the property. | Land | Improvement |
|---|---|---|---|---|
| 2024 | $2,338 | $92,000 | $24,000 | $68,000 |
| 2023 | $2,338 | $83,800 | $24,000 | $59,800 |
| 2022 | $2,111 | $74,400 | $24,000 | $50,400 |
| 2021 | $1,750 | $61,600 | $11,200 | $50,400 |
| 2020 | $1,642 | $53,080 | $11,200 | $41,880 |
| 2019 | $1,667 | $53,080 | $11,200 | $41,880 |
| 2018 | $1,621 | $51,080 | $11,200 | $39,880 |
| 2017 | $1,587 | $49,632 | $11,200 | $38,432 |
| 2016 | $1,595 | $49,632 | $11,200 | $38,432 |
| 2015 | $1,553 | $46,602 | $10,000 | $36,602 |
| 2014 | $1,397 | $41,858 | $10,000 | $31,858 |
| 2013 | -- | $40,442 | $10,000 | $30,442 |
Source: Public Records
Map
Nearby Homes
- 290 Bullock Pass
- 274 Bullock Pass
- 210 Bullock Pass
- 198 Bullock Pass
- 178 Bullock Pass
- 178 Bullock Pass Unit 5
- 1571 Highway 124 W
- 218 Bullock Pass
- Denton Plan at Jackson Creek - Jackson Landing
- Halton Plan at Jackson Creek - Jackson Landing
- Hayden Plan at Jackson Landing
- Cali Plan at Jackson Landing
- Galen Plan at Jackson Landing
- 285 Meadowcreek Dr
- 438 Indian River Dr
- 349 Indian River Dr
- 506 Canoe Dr
- 0 Albert Ln Unit 7078657
- 0 Albert Ln Unit 7294223
- 0 Albert Ln Unit 7235181
- 0 Albert Ln Unit 7194643
- 0 Albert Ln Unit 3236414
- 0 Albert Ln Unit 3216969
- 0 Albert Ln Unit 8460786
- 0 Albert Ln Unit 8277209
- 0 Albert Ln Unit 3149098
- 0 Albert Ln Unit 3182064
- 152 Albert Ln
- 33 Eugene Ct
- 117 Albert Ln
- 135 Albert Ln
- 67 Eugene Ct
- 91 Albert Ln
- 208 Albert Ln
- 163 Albert Ln
- 65 Albert Ln
- 232 Albert Ln