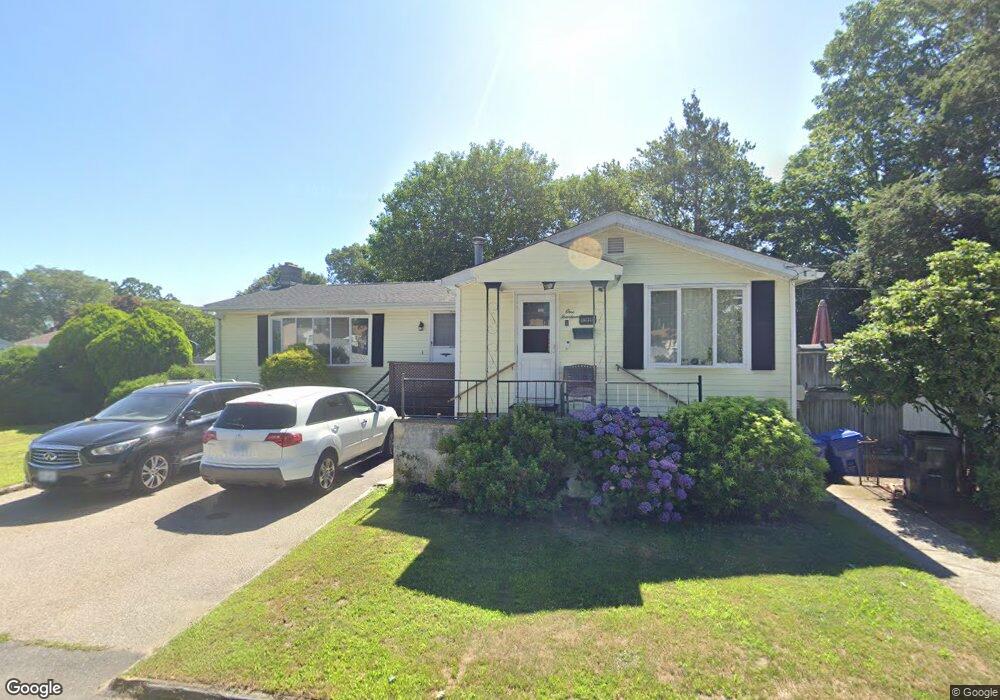
114 Appian Way East Providence, RI 02914
Carpenters Corner NeighborhoodEstimated Value: $425,381 - $450,000
3
Beds
2
Baths
1,940
Sq Ft
$226/Sq Ft
Est. Value
About This Home
This home is located at 114 Appian Way, East Providence, RI 02914 and is currently estimated at $438,345, approximately $225 per square foot. 114 Appian Way is a home located in Providence County with nearby schools including East Providence High School, Ocean State Montessori School, and The Gordon School.
Ownership History
Date
Name
Owned For
Owner Type
Purchase Details
Closed on
Jul 19, 2022
Sold by
Caffey-Mcdowell Jo Ann
Bought by
Mcdowel Charles A and Caffey-Mcdowell Jo Ann
Current Estimated Value
Purchase Details
Closed on
Mar 2, 2022
Sold by
Mcdowell Charles A
Bought by
Caffey-Mcdowell Jo Ann
Purchase Details
Closed on
Sep 3, 2021
Sold by
Mcdowell Jo-Ann C
Bought by
Mcdowell Charles A
Purchase Details
Closed on
Aug 12, 2003
Sold by
Jacqueline Caffey and Caffey Joseph
Bought by
Mcdowell Joann Caffey
Home Financials for this Owner
Home Financials are based on the most recent Mortgage that was taken out on this home.
Original Mortgage
$112,627
Interest Rate
5.28%
Purchase Details
Closed on
Nov 10, 1993
Sold by
Gomes Robertina
Bought by
Caffey Jacqueline A
Home Financials for this Owner
Home Financials are based on the most recent Mortgage that was taken out on this home.
Original Mortgage
$50,000
Interest Rate
6.79%
Create a Home Valuation Report for This Property
The Home Valuation Report is an in-depth analysis detailing your home's value as well as a comparison with similar homes in the area
Home Values in the Area
Average Home Value in this Area
Purchase History
| Date | Buyer | Sale Price | Title Company |
|---|---|---|---|
| Mcdowel Charles A | -- | None Available | |
| Caffey-Mcdowell Jo Ann | -- | None Available | |
| Mcdowell Charles A | -- | None Available | |
| Mcdowell Joann Caffey | $170,000 | -- | |
| Caffey Jacqueline A | $90,000 | -- |
Source: Public Records
Mortgage History
| Date | Status | Borrower | Loan Amount |
|---|---|---|---|
| Previous Owner | Caffey Jacqueline A | $112,627 | |
| Previous Owner | Caffey Jacqueline A | $50,000 |
Source: Public Records
Tax History Compared to Growth
Tax History
| Year | Tax Paid | Tax Assessment Tax Assessment Total Assessment is a certain percentage of the fair market value that is determined by local assessors to be the total taxable value of land and additions on the property. | Land | Improvement |
|---|---|---|---|---|
| 2025 | $5,190 | $397,100 | $98,200 | $298,900 |
| 2024 | $5,091 | $332,100 | $81,800 | $250,300 |
| 2023 | $4,902 | $332,100 | $81,800 | $250,300 |
| 2022 | $4,840 | $221,400 | $41,900 | $179,500 |
| 2021 | $4,760 | $221,400 | $41,900 | $179,500 |
| 2020 | $4,559 | $221,400 | $41,900 | $179,500 |
| 2019 | $4,432 | $221,400 | $41,900 | $179,500 |
| 2018 | $4,418 | $193,100 | $43,800 | $149,300 |
| 2017 | $4,320 | $193,100 | $43,800 | $149,300 |
| 2016 | $4,298 | $193,100 | $43,800 | $149,300 |
| 2015 | $3,709 | $161,600 | $35,500 | $126,100 |
| 2014 | $3,709 | $161,600 | $35,500 | $126,100 |
Source: Public Records
Map
Nearby Homes
- 17 Brown St Unit 19
- 9 Apulia St
- 132 S Rose St
- 26 Mayflower St
- 18 Baker St Unit 20
- 108 Bliss St
- 109 Bliss St
- 164 Brightridge Ave
- 25 Fairview Ave
- 78 Ingraham St
- 400 Juniper St Unit C
- 400 Juniper St Unit B
- 400 Juniper St Unit A
- 322 Mauran Ave
- 25 Ide Ave
- 15 S Carpenter St
- 4 S Carpenter St
- 152 Freeborn Ave
- 674 N Broadway
- 74 Brookhaven Dr