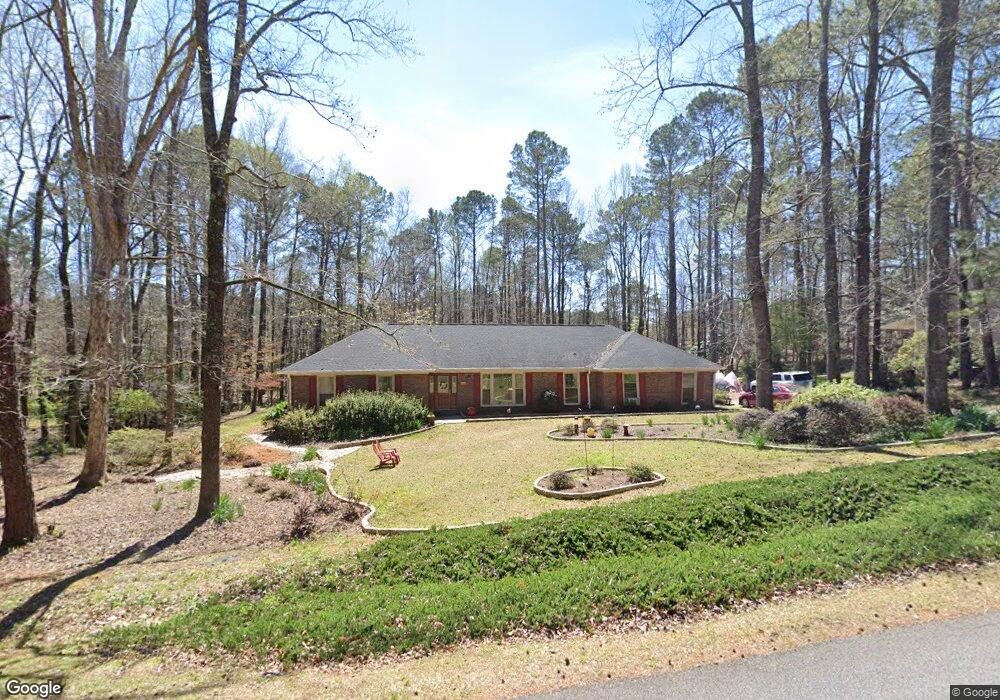
114 Ashling Dr Lagrange, GA 30240
Estimated Value: $327,574 - $371,000
4
Beds
2
Baths
2,365
Sq Ft
$149/Sq Ft
Est. Value
About This Home
This home is located at 114 Ashling Dr, Lagrange, GA 30240 and is currently estimated at $352,644, approximately $149 per square foot. 114 Ashling Dr is a home located in Troup County with nearby schools including Franklin Forest Elementary School, Hollis Hand Elementary School, and Ethel W. Kight Elementary School.
Ownership History
Date
Name
Owned For
Owner Type
Purchase Details
Closed on
Jun 19, 2000
Sold by
Tiffany Keith L and Tiffany Aspinwall
Bought by
Landry Steven A and Landry Kathleen C
Current Estimated Value
Purchase Details
Closed on
Dec 27, 1996
Sold by
Paul G Mallory
Bought by
Tiffany Keith L and Tiffany Aspinwall
Purchase Details
Closed on
Dec 3, 1995
Sold by
Fred T Railsback
Bought by
Paul G Mallory
Purchase Details
Closed on
Aug 4, 1992
Sold by
Railsback Fred H
Bought by
Fred T Railsback
Purchase Details
Closed on
Jul 31, 1992
Sold by
Hudson Paul W and Hudson Josephine E
Bought by
Railsback Fred H
Purchase Details
Closed on
Sep 17, 1983
Sold by
Dan Ric and Est Ga Est
Bought by
Hudson Paul W and Hudson Josephine E
Purchase Details
Closed on
Jun 29, 1981
Bought by
Dan Ric and Est Ga Est
Create a Home Valuation Report for This Property
The Home Valuation Report is an in-depth analysis detailing your home's value as well as a comparison with similar homes in the area
Purchase History
| Date | Buyer | Sale Price | Title Company |
|---|---|---|---|
| Landry Steven A | $156,000 | -- | |
| Tiffany Keith L | $125,000 | -- | |
| Paul G Mallory | $124,000 | -- | |
| Fred T Railsback | -- | -- | |
| Railsback Fred H | $110,000 | -- | |
| Hudson Paul W | $12,000 | -- | |
| Dan Ric | -- | -- |
Source: Public Records
Tax History
| Year | Tax Paid | Tax Assessment Tax Assessment Total Assessment is a certain percentage of the fair market value that is determined by local assessors to be the total taxable value of land and additions on the property. | Land | Improvement |
|---|---|---|---|---|
| 2025 | $3,488 | $127,888 | $18,000 | $109,888 |
| 2024 | $2,889 | $105,932 | $18,000 | $87,932 |
| 2023 | $2,831 | $103,812 | $14,000 | $89,812 |
| 2022 | $2,747 | $98,412 | $14,000 | $84,412 |
| 2021 | $2,242 | $74,352 | $14,000 | $60,352 |
| 2020 | $2,242 | $74,352 | $14,000 | $60,352 |
| 2019 | $1,988 | $65,924 | $12,000 | $53,924 |
| 2018 | $1,872 | $62,084 | $10,160 | $51,924 |
| 2017 | $1,682 | $55,784 | $8,700 | $47,084 |
| 2016 | $1,686 | $55,896 | $8,700 | $47,196 |
| 2015 | $1,734 | $57,392 | $10,196 | $47,196 |
| 2014 | $1,662 | $54,908 | $10,196 | $44,712 |
| 2013 | -- | $60,044 | $10,092 | $49,952 |
Source: Public Records
Map
Nearby Homes
- 1784 Mooty Bridge Rd
- 104 Sweetgum Dr
- 104 Englewood Dr
- 114 Red Oak Trail
- 502 Ashford Cir
- 103 Woodchase
- 103 Windridge
- 102 Beech Creek Dr
- 107 Windridge
- 204 Dixie Creek Dr
- 109 Windridge
- 209 River Oaks Dr
- 91 Richmond Dr
- 110 Pond View Point
- 203 S Chilton Crescent
- 201 S Chilton Crescent
- 732 Camellia Dr
- 724 Camellia Dr
- 106 Ewing St
- 106 Highland Park
- 112 Ashling Dr
- 116 Ashling Dr
- 115 Ashling Dr
- 110 Ashling Dr
- 113 Ashling Dr
- 111 St Anthony Dr
- 111 St Anthony Dr Unit LOT 5 & 6
- 113 Saint Anthony Dr
- 117 Ashling Dr
- 118 Ashling Dr
- 107 Saint Anthony Dr
- 107 St Anthony Dr
- 111 Ashling Dr
- 111 Ashling Dr Unit 6
- 115 St Anthony Dr
- 108 Ashling Dr
- 120 Ashling Dr
- 119 Ashling Dr
- 210 Ridgeview Ct
- 101 Lismore Dr
Your Personal Tour Guide
Ask me questions while you tour the home.