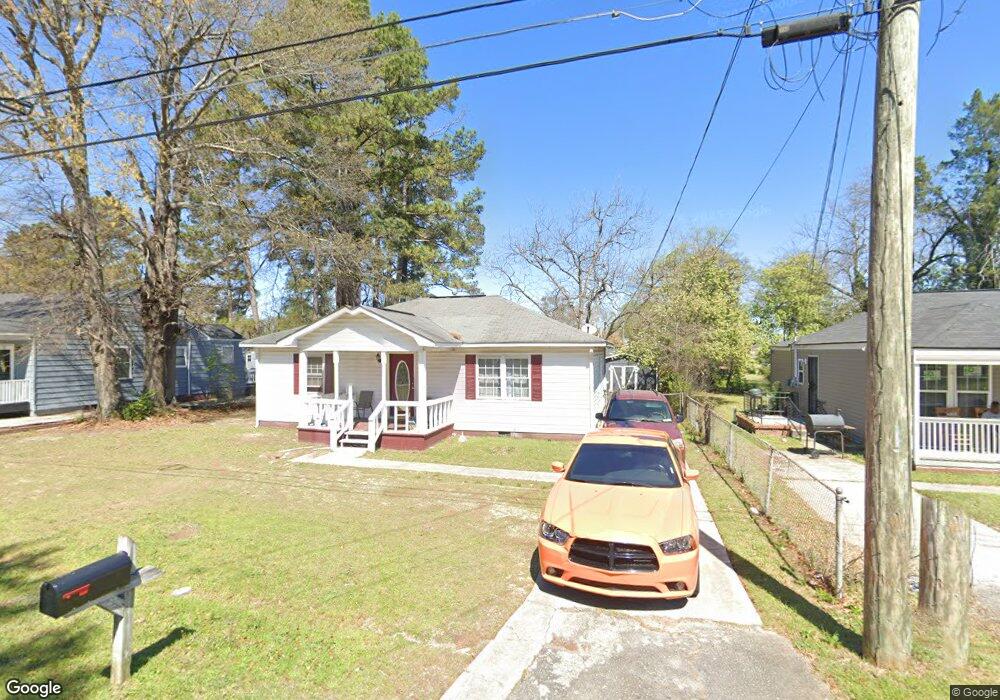
114 Astor St Warner Robins, GA 31093
Estimated Value: $87,000 - $111,085
--
Bed
1
Bath
1,026
Sq Ft
$97/Sq Ft
Est. Value
About This Home
This home is located at 114 Astor St, Warner Robins, GA 31093 and is currently estimated at $99,521, approximately $96 per square foot. 114 Astor St is a home located in Houston County with nearby schools including C. B. Watson Primary School, Pearl Stephens Elementary School, and Huntington Middle School.
Ownership History
Date
Name
Owned For
Owner Type
Purchase Details
Closed on
Feb 21, 2023
Sold by
Thomas John
Bought by
Thomas John
Current Estimated Value
Purchase Details
Closed on
Oct 5, 2022
Sold by
Thomas-Haynie Takisha
Bought by
Thomas John
Purchase Details
Closed on
Aug 26, 2022
Sold by
Yvonne Lesane
Bought by
Lesane Tiffany
Purchase Details
Closed on
Dec 16, 2021
Sold by
Sheldon Booker
Bought by
Lesane Yvonne
Purchase Details
Closed on
Oct 15, 2021
Sold by
Anne Wannamaker
Bought by
Thomas Ricky and Thomas Andre
Purchase Details
Closed on
Jul 21, 2006
Sold by
Poling William B and Poling Cristy L
Bought by
Wannamaker Anne M
Purchase Details
Closed on
May 30, 2003
Sold by
Raines Horace
Bought by
Poling William B and Poling Christy L
Purchase Details
Closed on
Jul 23, 2001
Sold by
Anderson Lonnie
Bought by
Raines Horace
Purchase Details
Closed on
Jan 15, 1968
Bought by
Anderson Lonnie
Create a Home Valuation Report for This Property
The Home Valuation Report is an in-depth analysis detailing your home's value as well as a comparison with similar homes in the area
Home Values in the Area
Average Home Value in this Area
Purchase History
| Date | Buyer | Sale Price | Title Company |
|---|---|---|---|
| Thomas John | -- | -- | |
| Thomas John | $60,000 | -- | |
| Lesane Tiffany | -- | -- | |
| Lesane Tiffany | -- | None Listed On Document | |
| Lesane Yvonne | -- | None Listed On Document | |
| Thomas Ricky | -- | Davis Rodney E | |
| Wannamaker Anne M | $56,500 | None Available | |
| Poling William B | $51,000 | -- | |
| Raines Horace | $12,000 | -- | |
| Anderson Lonnie | -- | -- |
Source: Public Records
Tax History Compared to Growth
Tax History
| Year | Tax Paid | Tax Assessment Tax Assessment Total Assessment is a certain percentage of the fair market value that is determined by local assessors to be the total taxable value of land and additions on the property. | Land | Improvement |
|---|---|---|---|---|
| 2024 | $746 | $22,800 | $1,480 | $21,320 |
| 2023 | $626 | $19,000 | $1,480 | $17,520 |
| 2022 | $324 | $14,080 | $1,480 | $12,600 |
| 2021 | $285 | $12,320 | $1,480 | $10,840 |
| 2020 | $308 | $13,240 | $1,480 | $11,760 |
| 2019 | $308 | $13,240 | $1,480 | $11,760 |
| 2018 | $308 | $13,240 | $1,480 | $11,760 |
| 2017 | $308 | $13,240 | $1,480 | $11,760 |
| 2016 | $308 | $13,240 | $1,480 | $11,760 |
| 2015 | -- | $13,240 | $1,480 | $11,760 |
| 2014 | -- | $13,720 | $1,480 | $12,240 |
| 2013 | -- | $13,720 | $1,480 | $12,240 |
Source: Public Records
Map
Nearby Homes
- 404 N 5th St
- 104 Lady Ln
- 118 Arnold Blvd
- 215 Camellia Cir
- 308 Camellia Cir
- 150 Evergreen St
- 212 Arnold Blvd
- 214 S 3rd St
- 101 Jacobs Ln
- 301 Doyle St
- 304 S 2nd St
- 116 Tabor Dr
- 102 Camellia Cir
- 206 Sunstede Rd
- 720 N Davis Dr
- 307 Arnold Blvd
- 315 Arnold Blvd
- 105 Angela Ave
- 117 Forest Park Dr
- 714 Camellia Cir