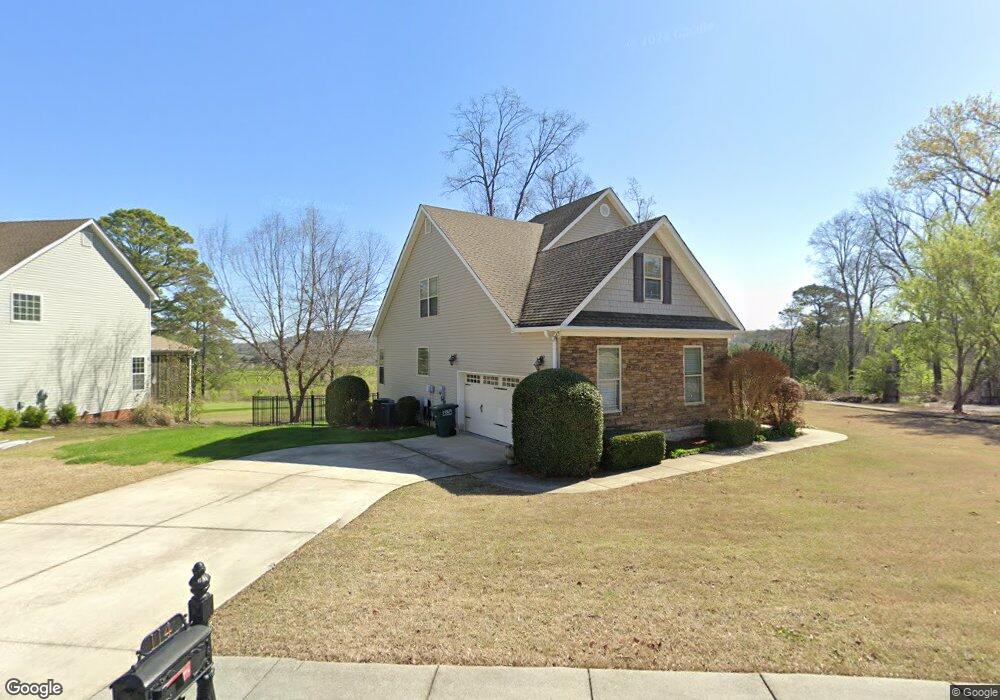
114 Avenue of The Oaks Rock Spring, GA 30739
Rock Spring NeighborhoodEstimated Value: $377,643 - $392,000
4
Beds
3
Baths
2,235
Sq Ft
$172/Sq Ft
Est. Value
About This Home
This home is located at 114 Avenue of The Oaks, Rock Spring, GA 30739 and is currently estimated at $383,411, approximately $171 per square foot. 114 Avenue of The Oaks is a home located in Walker County with nearby schools including Lafayette High School and Oakwood Christian Academy.
Ownership History
Date
Name
Owned For
Owner Type
Purchase Details
Closed on
Oct 21, 2015
Sold by
Lockwood James A
Bought by
Owen Goff and Owen Lyn R
Current Estimated Value
Home Financials for this Owner
Home Financials are based on the most recent Mortgage that was taken out on this home.
Original Mortgage
$178,000
Outstanding Balance
$140,096
Interest Rate
3.89%
Mortgage Type
New Conventional
Estimated Equity
$243,315
Purchase Details
Closed on
Jun 3, 2011
Sold by
Buckner Robert E
Bought by
Lockwood James A
Home Financials for this Owner
Home Financials are based on the most recent Mortgage that was taken out on this home.
Original Mortgage
$171,700
Interest Rate
4.75%
Mortgage Type
FHA
Purchase Details
Closed on
Mar 30, 2010
Sold by
Southland Builders Inc
Bought by
Buckner Robert E
Purchase Details
Closed on
Nov 30, 2005
Sold by
Not Provided
Bought by
Lockwood James A and Lockwood Monica Joy
Purchase Details
Closed on
Mar 3, 2004
Bought by
Fieldstone Farms Llc
Create a Home Valuation Report for This Property
The Home Valuation Report is an in-depth analysis detailing your home's value as well as a comparison with similar homes in the area
Home Values in the Area
Average Home Value in this Area
Purchase History
| Date | Buyer | Sale Price | Title Company |
|---|---|---|---|
| Owen Goff | $196,500 | -- | |
| Lockwood James A | $190,000 | -- | |
| Buckner Robert E | $205,000 | -- | |
| Lockwood James A | $58,000 | -- | |
| Fieldstone Farms Llc | $392,000 | -- |
Source: Public Records
Mortgage History
| Date | Status | Borrower | Loan Amount |
|---|---|---|---|
| Open | Owen Goff | $178,000 | |
| Previous Owner | Buckner Robert E | $171,700 |
Source: Public Records
Tax History Compared to Growth
Tax History
| Year | Tax Paid | Tax Assessment Tax Assessment Total Assessment is a certain percentage of the fair market value that is determined by local assessors to be the total taxable value of land and additions on the property. | Land | Improvement |
|---|---|---|---|---|
| 2024 | $2,971 | $133,590 | $10,000 | $123,590 |
| 2023 | $2,892 | $127,232 | $10,000 | $117,232 |
| 2022 | $2,748 | $111,116 | $10,000 | $101,116 |
| 2021 | $2,536 | $92,314 | $10,000 | $82,314 |
| 2020 | $2,158 | $74,865 | $10,000 | $64,865 |
| 2019 | $2,173 | $73,991 | $10,000 | $63,991 |
| 2018 | $1,958 | $73,991 | $10,000 | $63,991 |
| 2017 | $2,377 | $73,991 | $10,000 | $63,991 |
| 2016 | $1,892 | $73,991 | $10,000 | $63,991 |
| 2015 | $2,078 | $76,800 | $11,600 | $65,200 |
| 2014 | $1,952 | $76,800 | $11,600 | $65,200 |
| 2013 | -- | $76,800 | $11,600 | $65,200 |
Source: Public Records
Map
Nearby Homes
- 103 Deer Ridge Ln
- 200 Hunting Ridge Cir
- 124 Fieldstone Commons
- 54 Cedar Farm Ln
- 28 Cobblestone Trail
- 149 Stone Throw Ln
- 135 Stone Throw Ln
- 918 Old Lafayette Rd
- 74 Sycamore Dr
- 269 Quartz Dr
- 283 Quartz Dr
- 44 Bending Oak Dr
- 190 Sycamore Dr
- 1121 Arnold Rd
- 162 Bending Oak Dr
- 183 Long Hollow Rd
- 788 Long Hollow Rd
- 294 E Long Hollow Rd
- 1476 Arnold Rd
- 680 Glass Mill Rd
- 114 Avenue of The Oaks
- 130 Avenue of The Oaks
- 130 Avenue of The Oaks
- 86 Avenue of The Oaks
- 144 Avenue of The Oaks
- 144 Avenue of The Oaks
- Lot 95 Avenue of The Oaks
- 160 Avenue of The Oaks
- 324 Avenue of The Oaks
- 306 Avenue of The Oaks
- 306 Avenue of The Oaks
- 324 Avenue of Oaks
- 292 Avenue of The Oaks
- 292 Avenue of Oaks
- 174 Avenue of The Oaks
- 174 Ave of The Oaks
- 14 Avenue of The Oaks
- 262 S Avenue of Oaks Ave
- 58 Avenue of The Oaks
- 58 Avenue of The Oaks