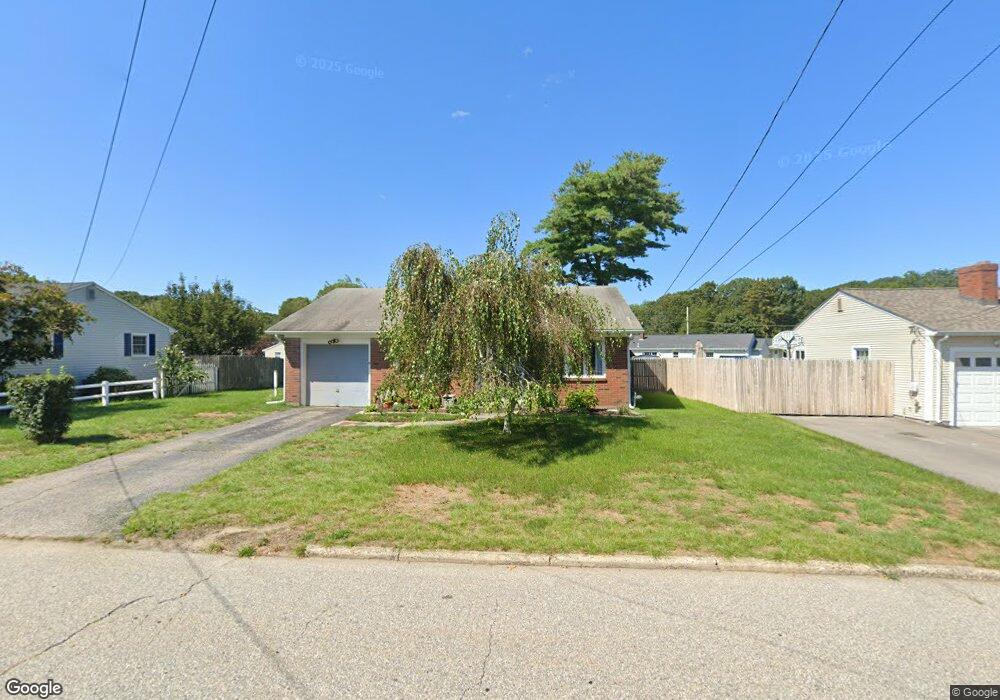
114 Beverly Rd Riverside, RI 02915
Riverside NeighborhoodEstimated Value: $428,257 - $469,000
3
Beds
1
Bath
1,188
Sq Ft
$379/Sq Ft
Est. Value
About This Home
This home is located at 114 Beverly Rd, Riverside, RI 02915 and is currently estimated at $450,814, approximately $379 per square foot. 114 Beverly Rd is a home located in Providence County with nearby schools including East Providence High School, St Luke Elementary School, and St Mary Academy-Bay View.
Ownership History
Date
Name
Owned For
Owner Type
Purchase Details
Closed on
Jul 24, 1997
Sold by
Kilcoyne James E and Kilcoyne Elizabeth
Bought by
Kilcoyne David E
Current Estimated Value
Home Financials for this Owner
Home Financials are based on the most recent Mortgage that was taken out on this home.
Original Mortgage
$64,000
Interest Rate
7.7%
Create a Home Valuation Report for This Property
The Home Valuation Report is an in-depth analysis detailing your home's value as well as a comparison with similar homes in the area
Home Values in the Area
Average Home Value in this Area
Purchase History
| Date | Buyer | Sale Price | Title Company |
|---|---|---|---|
| Kilcoyne David E | $95,000 | -- |
Source: Public Records
Mortgage History
| Date | Status | Borrower | Loan Amount |
|---|---|---|---|
| Closed | Kilcoyne David E | $75,000 | |
| Closed | Kilcoyne David E | $85,000 | |
| Closed | Kilcoyne David E | $64,000 |
Source: Public Records
Tax History
| Year | Tax Paid | Tax Assessment Tax Assessment Total Assessment is a certain percentage of the fair market value that is determined by local assessors to be the total taxable value of land and additions on the property. | Land | Improvement |
|---|---|---|---|---|
| 2025 | $4,918 | $376,300 | $132,900 | $243,400 |
| 2024 | $4,932 | $321,700 | $110,800 | $210,900 |
| 2023 | $4,748 | $321,700 | $110,800 | $210,900 |
| 2022 | $4,479 | $204,900 | $53,100 | $151,800 |
| 2021 | $4,405 | $204,900 | $53,100 | $151,800 |
| 2020 | $4,219 | $204,900 | $53,100 | $151,800 |
| 2019 | $4,102 | $204,900 | $53,100 | $151,800 |
| 2018 | $4,292 | $187,600 | $64,700 | $122,900 |
| 2017 | $4,197 | $187,600 | $64,700 | $122,900 |
| 2016 | $4,176 | $187,600 | $64,700 | $122,900 |
| 2015 | $4,009 | $174,700 | $54,600 | $120,100 |
| 2014 | $4,009 | $174,700 | $54,600 | $120,100 |
Source: Public Records
Map
Nearby Homes
Your Personal Tour Guide
Ask me questions while you tour the home.