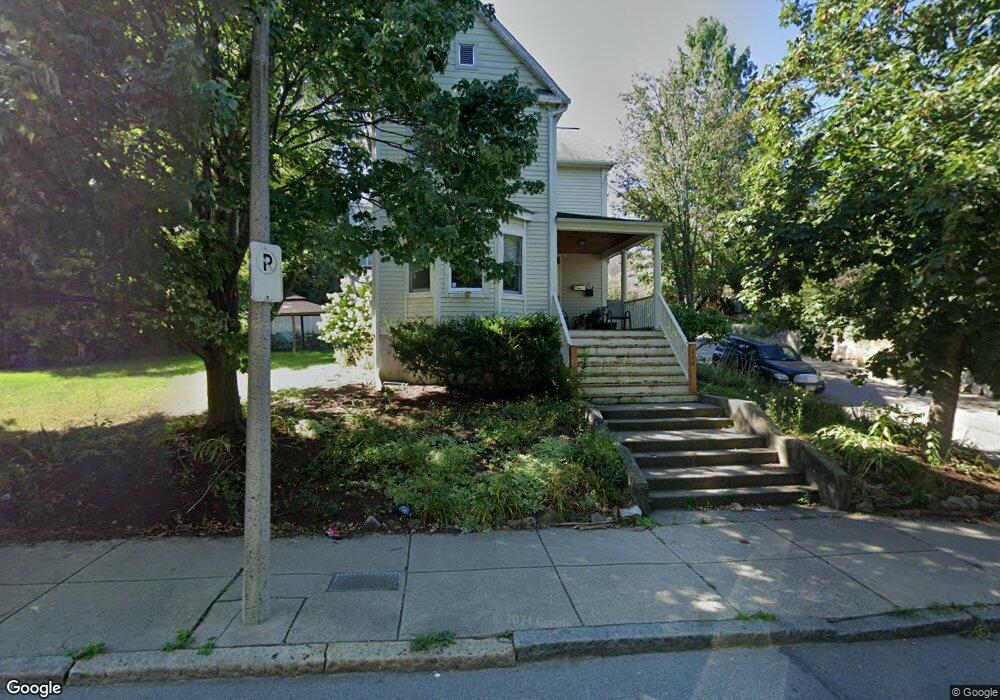
114 Cedar St Roxbury, MA 02119
Fort Hill NeighborhoodEstimated Value: $475,000 - $632,378
3
Beds
2
Baths
1,276
Sq Ft
$447/Sq Ft
Est. Value
About This Home
This home is located at 114 Cedar St, Roxbury, MA 02119 and is currently estimated at $570,095, approximately $446 per square foot. 114 Cedar St is a home located in Suffolk County with nearby schools including Paige Academy, Malik Academy, and Manville School.
Ownership History
Date
Name
Owned For
Owner Type
Purchase Details
Closed on
Aug 19, 2002
Sold by
Veterans Clearinghouse
Bought by
Pryor Delanie and Pryor Donald
Current Estimated Value
Home Financials for this Owner
Home Financials are based on the most recent Mortgage that was taken out on this home.
Original Mortgage
$183,549
Interest Rate
6.61%
Mortgage Type
Purchase Money Mortgage
Create a Home Valuation Report for This Property
The Home Valuation Report is an in-depth analysis detailing your home's value as well as a comparison with similar homes in the area
Home Values in the Area
Average Home Value in this Area
Purchase History
| Date | Buyer | Sale Price | Title Company |
|---|---|---|---|
| Pryor Delanie | $185,000 | -- |
Source: Public Records
Mortgage History
| Date | Status | Borrower | Loan Amount |
|---|---|---|---|
| Open | Pryor Delanie | $15,000 | |
| Open | Pryor Delanie | $187,000 | |
| Closed | Pryor Delanie | $183,549 |
Source: Public Records
Tax History Compared to Growth
Tax History
| Year | Tax Paid | Tax Assessment Tax Assessment Total Assessment is a certain percentage of the fair market value that is determined by local assessors to be the total taxable value of land and additions on the property. | Land | Improvement |
|---|---|---|---|---|
| 2025 | $5,965 | $515,100 | $169,983 | $345,117 |
| 2024 | $5,348 | $490,600 | $132,462 | $358,138 |
| 2023 | $5,018 | $467,200 | $126,144 | $341,056 |
| 2022 | $4,842 | $445,000 | $120,150 | $324,850 |
| 2021 | $4,522 | $423,800 | $0 | $423,800 |
| 2020 | $4,262 | $403,600 | $0 | $403,600 |
| 2019 | $4,052 | $384,400 | $139,900 | $244,500 |
| 2018 | $3,837 | $366,100 | $139,900 | $226,200 |
| 2017 | $3,693 | $348,700 | $139,900 | $208,800 |
| 2016 | $3,653 | $332,100 | $139,900 | $192,200 |
| 2015 | $3,830 | $316,300 | $100,800 | $215,500 |
| 2014 | $3,789 | $301,200 | $100,800 | $200,400 |
Source: Public Records
Map
Nearby Homes
- 10 Linwood St
- 59 Fort Ave
- 31 Dorr St
- 4 Fort Ave Unit 2
- 49 Norfolk St
- 249 Roxbury St Unit 1
- 63 Beech Glen St
- 38 Juniper St
- 27 Dudley St
- 743 Parker St Unit 3
- 9 W Cedar St Unit 1
- 22 Fisher Ave
- 9-45 Vale St
- 51 Saint James St
- 64 Alpine St Unit 104
- 64 Alpine St Unit 304
- 2856 Washington St
- 37 Regent St Unit 2
- 8 Brinton St Unit 2
- 16 Mayfair St
- 26 Cedar Park Unit 28
- 28 Cedar Park Unit A
- 28 Cedar Park
- 99 Highland St
- 101 Highland St
- 35 Cedar Park
- 105 Cedar St Unit 3
- 105 Cedar St Unit 2
- 105 Cedar St Unit 1
- 105 Cedar St Unit 12
- 105 Cedar St
- 126 Cedar St Unit B
- 126 Cedar St Unit 1
- 126 Cedar St
- 126 Cedar St Unit G
- 103 Cedar St
- 103 Cedar St
- 103 Cedar St Unit 2
- 103 Highland St
- 101 Cedar St Unit 3