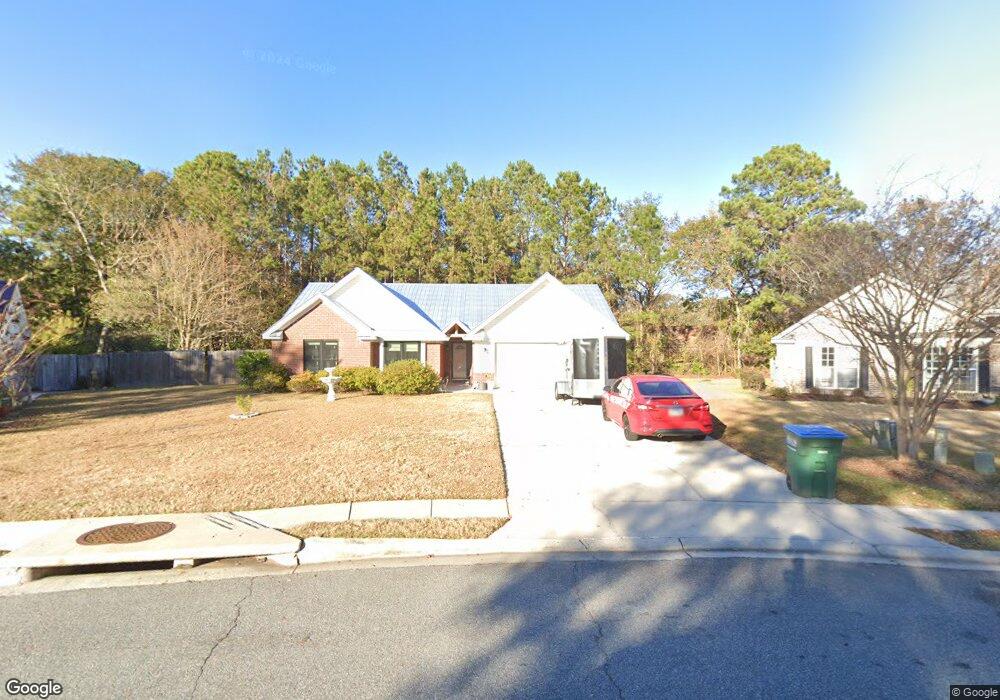
114 Crossing Cir Rincon, GA 31326
Estimated Value: $268,008 - $338,000
Studio
1
Bath
1,857
Sq Ft
$161/Sq Ft
Est. Value
About This Home
This home is located at 114 Crossing Cir, Rincon, GA 31326 and is currently estimated at $299,752, approximately $161 per square foot. 114 Crossing Cir is a home located in Effingham County with nearby schools including Rincon Elementary School, Ebenezer Middle School, and Effingham County High School.
Ownership History
Date
Name
Owned For
Owner Type
Purchase Details
Closed on
Jun 10, 2013
Sold by
Anderson Miriam
Bought by
Anderson Miriam and Harn Brandi Lynn
Current Estimated Value
Home Financials for this Owner
Home Financials are based on the most recent Mortgage that was taken out on this home.
Original Mortgage
$82,500
Outstanding Balance
$57,768
Interest Rate
3.37%
Mortgage Type
New Conventional
Estimated Equity
$241,984
Purchase Details
Closed on
May 31, 2013
Sold by
Daniels Debra
Bought by
Anderson Miriam
Home Financials for this Owner
Home Financials are based on the most recent Mortgage that was taken out on this home.
Original Mortgage
$82,500
Outstanding Balance
$57,768
Interest Rate
3.37%
Mortgage Type
New Conventional
Estimated Equity
$241,984
Purchase Details
Closed on
Jun 15, 2005
Sold by
Darwin Beasley Construction
Bought by
Daniels Debra
Home Financials for this Owner
Home Financials are based on the most recent Mortgage that was taken out on this home.
Original Mortgage
$111,920
Interest Rate
5.66%
Mortgage Type
New Conventional
Create a Home Valuation Report for This Property
The Home Valuation Report is an in-depth analysis detailing your home's value as well as a comparison with similar homes in the area
Home Values in the Area
Average Home Value in this Area
Purchase History
| Date | Buyer | Sale Price | Title Company |
|---|---|---|---|
| Anderson Miriam | -- | -- | |
| Anderson Miriam | $110,000 | -- | |
| Daniels Debra | $139,900 | -- |
Source: Public Records
Mortgage History
| Date | Status | Borrower | Loan Amount |
|---|---|---|---|
| Open | Anderson Miriam | $82,500 | |
| Previous Owner | Daniels Debra | $111,920 | |
| Previous Owner | Daniels Debra | $13,990 |
Source: Public Records
Tax History
| Year | Tax Paid | Tax Assessment Tax Assessment Total Assessment is a certain percentage of the fair market value that is determined by local assessors to be the total taxable value of land and additions on the property. | Land | Improvement |
|---|---|---|---|---|
| 2025 | $2,486 | $101,239 | $22,800 | $78,439 |
| 2024 | $2,486 | $104,997 | $22,800 | $82,197 |
| 2023 | $2,267 | $92,984 | $17,600 | $75,384 |
| 2022 | $2,158 | $81,976 | $17,600 | $64,376 |
| 2021 | $2,025 | $75,720 | $14,000 | $61,720 |
| 2020 | $1,892 | $64,973 | $12,000 | $52,973 |
| 2019 | $1,862 | $64,973 | $12,000 | $52,973 |
| 2018 | $1,701 | $60,869 | $12,000 | $48,869 |
| 2017 | $1,727 | $60,869 | $12,000 | $48,869 |
| 2016 | $1,811 | $63,244 | $15,200 | $48,044 |
| 2015 | $1,729 | $60,044 | $12,000 | $48,044 |
| 2014 | $1,746 | $60,044 | $12,000 | $48,044 |
| 2013 | -- | $49,319 | $6,400 | $42,919 |
Source: Public Records
Map
Nearby Homes
- 108 Crossing Cir
- 301 Cone St
- 430 Plantation Way
- 119 Fox Trace
- 313 Crosswinds Dr
- 329 Crosswinds Dr
- 808 Lexington Ave
- 100 Susan Dr
- 114 Danielle Loop
- 801 Lexington Ave
- 704 Lexington Ave
- 361 Crosswinds Dr
- 363 Crosswinds Dr
- 180 Foxridge Ct
- 3072 Rincon Stillwell Rd
- 406 Lexington Ave
- 811 Rosalie Ct
- 120 Four Oaks Ct
- 407 Lexington Ave
- 221 Oakwood Ct
- 116 Crossing Cir
- 112 Crossing Cir
- 118 Crossing Cir
- 110 Crossing Cir
- 101 Crossing Cir
- 101 Crossing Cir Unit 15
- 401 Oak Ln
- 44 Talmadge Dr
- 403 Oak Ln
- 103 Crossing Cir
- 120 Crossing Cir
- 42 Talmadge Dr
- 200 Mikal St
- 202 Mikal St
- 106 Crossing Cir
- 122 Crossing Cir
- 105 Crossing Cir
- 204 Mikal St
- 405 Oak Ln
- 204 Mikal Dr
Your Personal Tour Guide
Ask me questions while you tour the home.