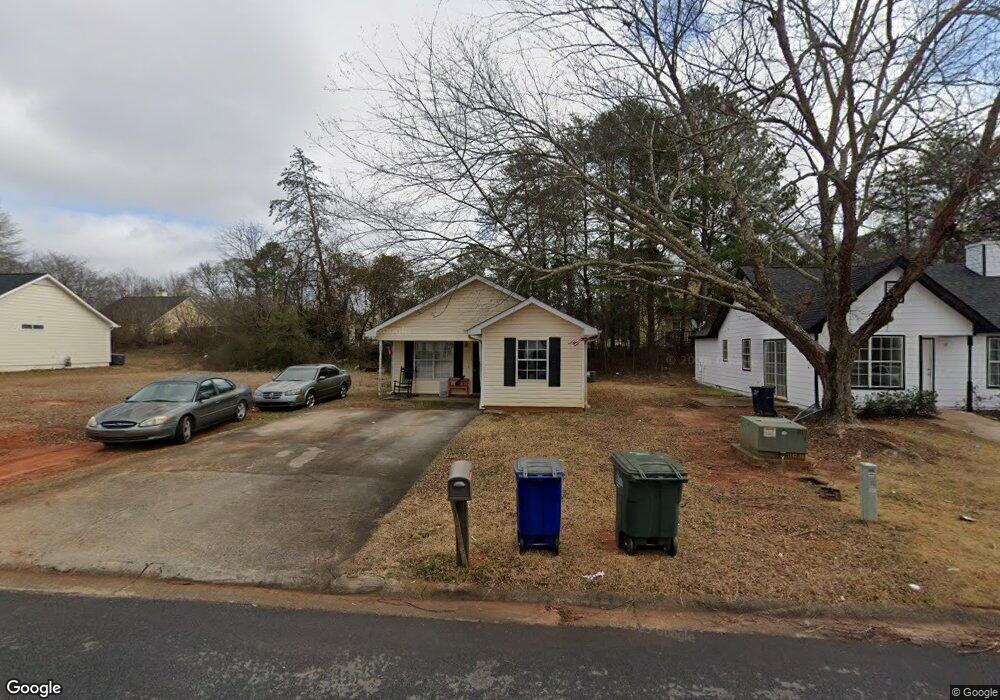
114 Crystal Brook Griffin, GA 30223
Spalding County NeighborhoodEstimated Value: $163,000 - $180,113
4
Beds
1
Bath
1,185
Sq Ft
$144/Sq Ft
Est. Value
About This Home
This home is located at 114 Crystal Brook, Griffin, GA 30223 and is currently estimated at $170,778, approximately $144 per square foot. 114 Crystal Brook is a home located in Spalding County with nearby schools including Cowan Road Elementary School, Cowan Road Middle School, and Griffin High School.
Ownership History
Date
Name
Owned For
Owner Type
Purchase Details
Closed on
Nov 21, 2008
Sold by
Hud-Housing Of Urban Dev
Bought by
Miller Rhonda B
Current Estimated Value
Home Financials for this Owner
Home Financials are based on the most recent Mortgage that was taken out on this home.
Original Mortgage
$53,708
Outstanding Balance
$35,133
Interest Rate
6.01%
Mortgage Type
FHA
Estimated Equity
$135,645
Purchase Details
Closed on
Mar 4, 2008
Sold by
Wells Fargo Bank Na
Bought by
Hud-Housing Of Urban Dev
Purchase Details
Closed on
May 15, 2007
Sold by
Murray G Niles
Bought by
Miller Donoval and Sims Jimmie
Home Financials for this Owner
Home Financials are based on the most recent Mortgage that was taken out on this home.
Original Mortgage
$77,850
Interest Rate
6.17%
Mortgage Type
FHA
Purchase Details
Closed on
Dec 27, 2006
Sold by
Wachovia Bk Na
Bought by
Murray G Niles
Purchase Details
Closed on
Jun 6, 2006
Sold by
Henry Garnett
Bought by
Wachovia Bk Na
Purchase Details
Closed on
Jan 28, 2002
Sold by
Equicredit Corp Of America
Bought by
Henry Garnett
Create a Home Valuation Report for This Property
The Home Valuation Report is an in-depth analysis detailing your home's value as well as a comparison with similar homes in the area
Home Values in the Area
Average Home Value in this Area
Purchase History
| Date | Buyer | Sale Price | Title Company |
|---|---|---|---|
| Miller Rhonda B | -- | -- | |
| Hud-Housing Of Urban Dev | -- | -- | |
| Wells Fargo Bank Na | $83,262 | -- | |
| Miller Donoval | $79,200 | -- | |
| Murray G Niles | $51,000 | -- | |
| Wachovia Bk Na | $61,200 | -- | |
| Henry Garnett | -- | -- |
Source: Public Records
Mortgage History
| Date | Status | Borrower | Loan Amount |
|---|---|---|---|
| Open | Miller Rhonda B | $53,708 | |
| Previous Owner | Miller Donoval | $77,850 |
Source: Public Records
Tax History Compared to Growth
Tax History
| Year | Tax Paid | Tax Assessment Tax Assessment Total Assessment is a certain percentage of the fair market value that is determined by local assessors to be the total taxable value of land and additions on the property. | Land | Improvement |
|---|---|---|---|---|
| 2024 | $2,306 | $60,383 | $6,000 | $54,383 |
| 2023 | $2,306 | $46,532 | $3,200 | $43,332 |
| 2022 | $1,513 | $37,855 | $3,200 | $34,655 |
| 2021 | $985 | $24,654 | $3,200 | $21,454 |
| 2020 | $887 | $22,202 | $3,200 | $19,002 |
| 2019 | $691 | $16,992 | $3,200 | $13,792 |
| 2018 | $655 | $15,511 | $3,200 | $12,311 |
| 2017 | $675 | $16,332 | $3,200 | $13,132 |
| 2016 | $686 | $16,332 | $3,200 | $13,132 |
| 2015 | $668 | $18,396 | $8,000 | $10,396 |
| 2014 | $809 | $18,396 | $8,000 | $10,396 |
Source: Public Records
Map
Nearby Homes
- 116 Crystal Brook
- 86 Crystal Brook Unit 3
- 150 Crystal Brook
- 82 Crystal Brook
- 164 Crystal Brook
- 115 1st Ave
- 1391 Experiment St Unit 12
- 1391 Experiment St
- 602 Melrose Ave
- 4038 W Mcintosh Rd
- 1464 Beatty St
- 116 Peachtree St
- 65 Elm St
- 121 Peachtree St
- 202 Cheatham St
- 1652 Hallmark Hills Dr
- 1643 Hallmark Hills Dr
- 2 Cedar Ave
- 1807 Ridge St
- 124 Ohoopee Dr
- 0 Crystal Brook Unit 8545857
- 0 Crystal Brook Unit 8279611
- 0 Crystal Brook Unit 8320426
- 0 Crystal Brook Unit 8262289
- 0 Crystal Brook Unit 8988026
- 0 Crystal Brook Unit 9004505
- 0 Crystal Brook Unit 9064002
- 0 Crystal Brook Unit 8807860
- 0 Crystal Brook Unit 8940085
- 0 Crystal Brook Unit 7059373
- 0 Crystal Brook Unit 7130572
- 110 Crystal Brook Unit 1
- 118 Wedgewood Walk
- 325 Crystal Brook
- 120 Wedgewood Walk
- 114 Wedgewood Walk Unit 1
- 120 Crystal Brook
- 111 Crystal Brook Unit 1
- 113 Crystal Brook Unit 1
- 108 Crystal Brook