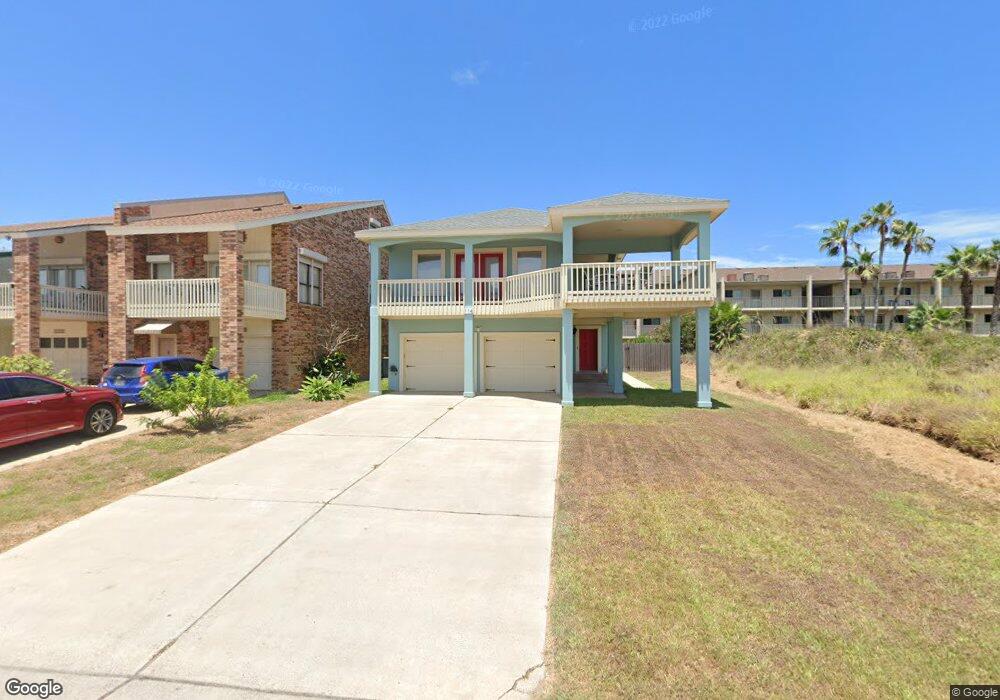
114 E Cora Lee Dr Unit 9 South Padre Island, TX 78597
Estimated Value: $727,000 - $871,000
3
Beds
3
Baths
2,004
Sq Ft
$388/Sq Ft
Est. Value
About This Home
This home is located at 114 E Cora Lee Dr Unit 9, South Padre Island, TX 78597 and is currently estimated at $778,119, approximately $388 per square foot. 114 E Cora Lee Dr Unit 9 is a home located in Cameron County with nearby schools including Garriga Elementary School, Derry Elementary School, and Port Isabel Junior High School.
Ownership History
Date
Name
Owned For
Owner Type
Purchase Details
Closed on
May 10, 2018
Sold by
Groves Christian J and Groves Jeanette S
Bought by
Garza Noe D and Kowaski Garza Adela
Current Estimated Value
Home Financials for this Owner
Home Financials are based on the most recent Mortgage that was taken out on this home.
Original Mortgage
$329,375
Outstanding Balance
$283,864
Interest Rate
4.44%
Mortgage Type
New Conventional
Estimated Equity
$494,255
Purchase Details
Closed on
May 2, 2013
Sold by
Kniech Laura Leigh and Kniech Robert G
Bought by
Groves Christian J and Groves Jeanette S
Home Financials for this Owner
Home Financials are based on the most recent Mortgage that was taken out on this home.
Original Mortgage
$337,500
Interest Rate
3.58%
Mortgage Type
New Conventional
Purchase Details
Closed on
Jun 2, 1999
Sold by
Rawls Molly Boon
Bought by
Tolland Laura Lee
Create a Home Valuation Report for This Property
The Home Valuation Report is an in-depth analysis detailing your home's value as well as a comparison with similar homes in the area
Home Values in the Area
Average Home Value in this Area
Purchase History
| Date | Buyer | Sale Price | Title Company |
|---|---|---|---|
| Garza Noe D | -- | None Available | |
| Groves Christian J | -- | Rio Grande Valley Abstract | |
| Tolland Laura Lee | -- | -- |
Source: Public Records
Mortgage History
| Date | Status | Borrower | Loan Amount |
|---|---|---|---|
| Open | Garza Noe D | $329,375 | |
| Previous Owner | Groves Christian J | $337,500 |
Source: Public Records
Tax History Compared to Growth
Tax History
| Year | Tax Paid | Tax Assessment Tax Assessment Total Assessment is a certain percentage of the fair market value that is determined by local assessors to be the total taxable value of land and additions on the property. | Land | Improvement |
|---|---|---|---|---|
| 2025 | $10,699 | $780,251 | $225,000 | $555,251 |
| 2024 | $10,699 | $655,243 | $225,000 | $430,243 |
| 2023 | $11,234 | $655,243 | $225,000 | $430,243 |
| 2022 | $9,933 | $524,194 | $175,000 | $349,194 |
| 2021 | $7,596 | $377,708 | $131,250 | $246,458 |
| 2020 | $7,701 | $380,330 | $131,250 | $249,080 |
| 2019 | $7,778 | $376,699 | $125,000 | $251,699 |
| 2018 | $8,114 | $393,209 | $125,000 | $268,209 |
| 2017 | $8,065 | $393,889 | $125,000 | $268,889 |
| 2016 | $8,079 | $394,572 | $125,000 | $269,572 |
| 2015 | $7,890 | $394,572 | $125,000 | $269,572 |
Source: Public Records
Map
Nearby Homes
- 116 E Cora Lee Dr Unit 4
- 116 E Cora Lee Dr Unit 2
- 116 E Cora Lee Dr Unit 1
- 116 E Cora Lee Dr Unit 3
- 111 E Morningside Dr Unit 104
- 111 E Morningside Dr Unit 209
- 111 E Morningside Dr Unit 307
- 111 E Morningside Dr Unit 105
- lot11&12 E Cora Lee Dr Unit 11&12
- 109 W Cora Lee Dr Unit 10
- 109 W Cora Lee Dr Unit 9
- 123 E Cora Lee Dr Unit 302
- 115 E Coronado Dr Unit 308
- 115 E Coronado Dr Unit 102
- 115 E Coronado Dr Unit 303
- 115 E Coronado Dr Unit 309
- 115 E Coronado Dr Unit 201
- 308 E Morningside Dr Unit 210
- 108 E Coronado Dr Unit 307
- 108 E Coronado Dr Unit 207
- 114 E Cora Lee Dr
- 116 E Cora Lee Dr Unit 10
- 116 E Cora Lee Dr
- 112B E Cora Lee Dr Unit 112
- 112B E Cora Lee Dr
- 112 E Cora Lee Dr
- 112 E Cora Lee Dr Unit B
- 112 E Cora Lee Dr Unit A
- 112A E Cora Lee Dr Unit A
- 115 Cora Lee Dr
- 111 E Morningside Dr
- 111 E Morningside Dr
- 111 E Morningside Dr
- 111 E Morningside Dr
- 111 E Morningside Dr
- 111 E Morningside Dr
- 111 E Morningside Dr
- 111 E Morningside Dr
- 111 E Morningside Dr
- 111 E Morningside Dr