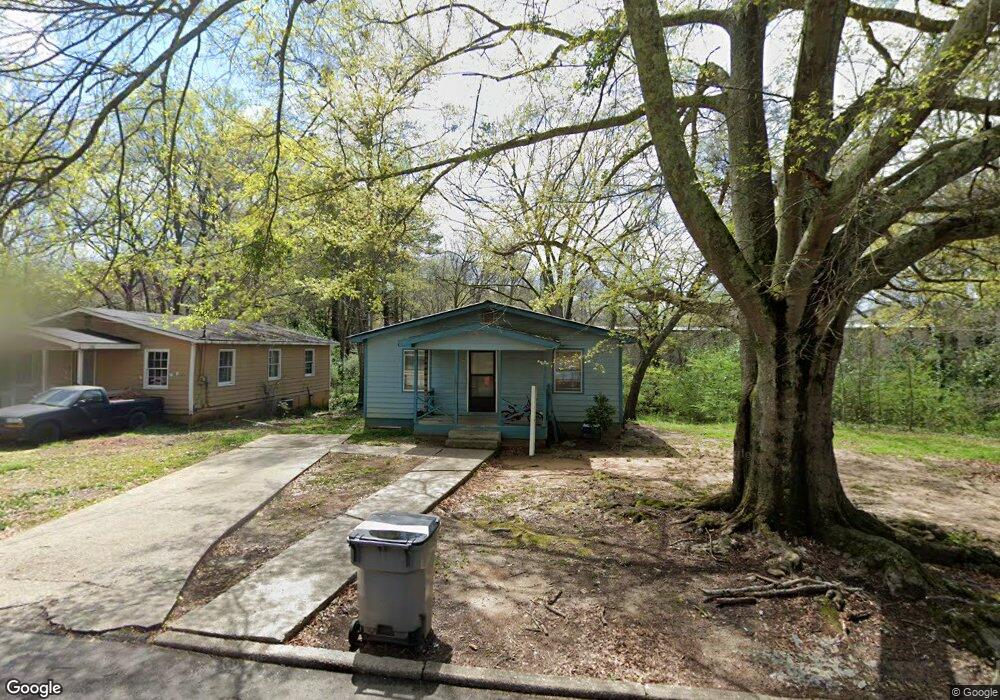
114 E Crovat St Lagrange, GA 30241
Estimated Value: $46,000 - $101,000
3
Beds
1
Bath
1,015
Sq Ft
$80/Sq Ft
Est. Value
About This Home
This home is located at 114 E Crovat St, Lagrange, GA 30241 and is currently estimated at $81,275, approximately $80 per square foot. 114 E Crovat St is a home located in Troup County with nearby schools including Callaway Elementary School, Hogansville Elementary School, and Callaway Middle School.
Ownership History
Date
Name
Owned For
Owner Type
Purchase Details
Closed on
Oct 5, 2011
Sold by
Deutsche Bank National
Bought by
Barnes James Sean
Current Estimated Value
Purchase Details
Closed on
Oct 7, 2008
Sold by
Barker Loretta
Bought by
Gates Willie H
Purchase Details
Closed on
Aug 11, 2008
Sold by
Gates Willie H
Bought by
Barker Loretta
Purchase Details
Closed on
Nov 6, 2006
Sold by
J G Davidson Jr Electrical
Bought by
Crig Mia
Home Financials for this Owner
Home Financials are based on the most recent Mortgage that was taken out on this home.
Original Mortgage
$26,125
Interest Rate
6.36%
Mortgage Type
New Conventional
Purchase Details
Closed on
Sep 26, 2006
Sold by
Jg Davidson Jr Electrical
Bought by
Barker Loretta
Home Financials for this Owner
Home Financials are based on the most recent Mortgage that was taken out on this home.
Original Mortgage
$26,125
Interest Rate
6.36%
Mortgage Type
New Conventional
Purchase Details
Closed on
Jan 1, 1967
Sold by
Davidson J G
Bought by
Jg Davidson Electrical Con
Create a Home Valuation Report for This Property
The Home Valuation Report is an in-depth analysis detailing your home's value as well as a comparison with similar homes in the area
Purchase History
| Date | Buyer | Sale Price | Title Company |
|---|---|---|---|
| Barnes James Sean | $10,200 | -- | |
| Gates Willie H | $2,050 | -- | |
| Barker Loretta | $2,893 | -- | |
| Crig Mia | $22,000 | -- | |
| Barker Loretta | $27,500 | -- | |
| Jg Davidson Electrical Con | -- | -- |
Source: Public Records
Mortgage History
| Date | Status | Borrower | Loan Amount |
|---|---|---|---|
| Previous Owner | Barker Loretta | $26,125 |
Source: Public Records
Tax History
| Year | Tax Paid | Tax Assessment Tax Assessment Total Assessment is a certain percentage of the fair market value that is determined by local assessors to be the total taxable value of land and additions on the property. | Land | Improvement |
|---|---|---|---|---|
| 2025 | $581 | $23,920 | $2,960 | $20,960 |
| 2024 | $581 | $21,320 | $2,960 | $18,360 |
| 2023 | $449 | $16,480 | $2,960 | $13,520 |
| 2022 | $373 | $13,360 | $2,960 | $10,400 |
| 2021 | $282 | $9,360 | $1,960 | $7,400 |
| 2020 | $282 | $9,360 | $1,960 | $7,400 |
| 2019 | $255 | $8,440 | $1,960 | $6,480 |
| 2018 | $256 | $8,480 | $2,000 | $6,480 |
| 2017 | $256 | $8,480 | $2,000 | $6,480 |
| 2016 | $272 | $9,026 | $2,000 | $7,026 |
| 2015 | $272 | $9,010 | $1,984 | $7,026 |
| 2014 | $261 | $8,641 | $1,984 | $6,657 |
| 2013 | -- | $9,247 | $1,984 | $7,263 |
Source: Public Records
Map
Nearby Homes
- 109 Bell St
- 101 Cedar St
- 501 Milam St
- 0 Boggs St Unit 10550243
- 0 Boggs St Unit 10550231
- 0 Boggs St Unit 10550239
- 0 Boggs St Unit 10550250
- 0 Bagley St
- 303 E Mulberry St
- 304 Butler St
- 901 Whiteline St
- 0 E Fendig St
- 113 E Fendig St
- 205 Fannin St
- 1191 Whitesville St
- 203 Fannin St
- 1201 Whitesville St
- 200 Mccall St
- 1186 Lindsey St
- 200 Peachtree St
- 116 E Crovat St
- 112 E Crovat St
- 118 E Crovat St
- 108 E Crovat St
- 120 E Crovat St
- 109 Fendig St
- 106 E Crovat St
- 109 E Crovat St
- 113 E Crovat St
- 104 E Crovat St
- 115 E Crovat St
- 111 Fendig St
- E E Crovat St
- 117 E Crovat St
- 107 E Crovat St
- 122 E Crovat St
- 102 E Crovat St
- 105 E Crovat St
- 124 E Crovat St
- 113 Deming St
Your Personal Tour Guide
Ask me questions while you tour the home.