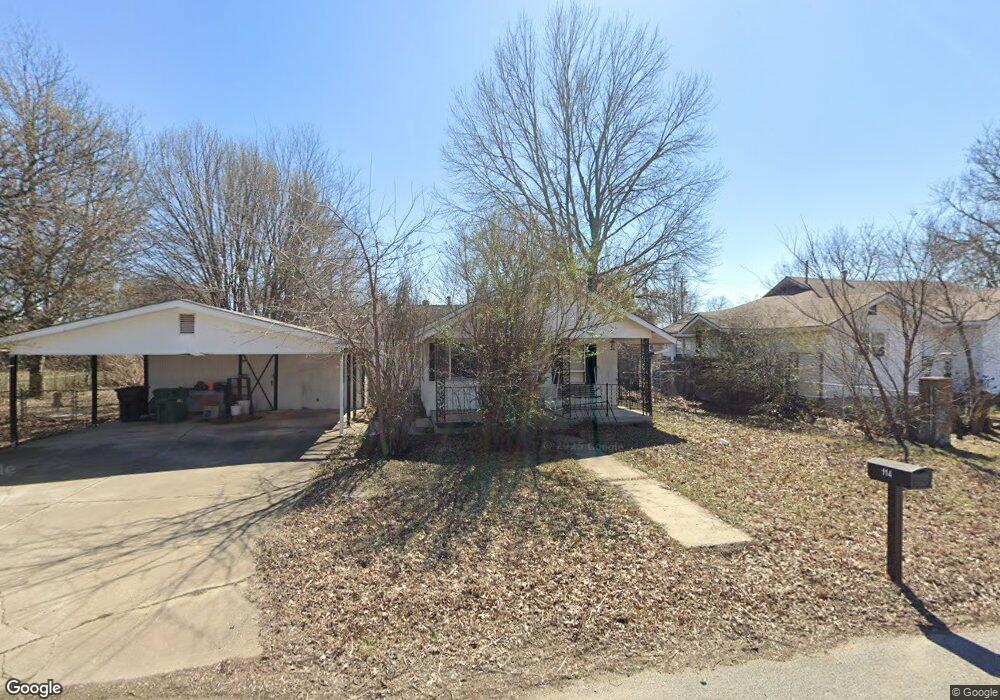
114 E Ross Ave Sapulpa, OK 74066
Estimated Value: $85,000 - $221,000
3
Beds
2
Baths
1,590
Sq Ft
$93/Sq Ft
Est. Value
About This Home
This home is located at 114 E Ross Ave, Sapulpa, OK 74066 and is currently estimated at $147,667, approximately $92 per square foot. 114 E Ross Ave is a home located in Creek County with nearby schools including Sapulpa Middle School, Sapulpa Junior High School, and Sapulpa High School.
Ownership History
Date
Name
Owned For
Owner Type
Purchase Details
Closed on
Oct 31, 2024
Sold by
Dna Holdings Llc
Bought by
Cahill Property Developments Llc
Current Estimated Value
Purchase Details
Closed on
Aug 20, 2013
Sold by
Hardison Marlene E and Hardison Ronnie
Bought by
Newton David Scott
Home Financials for this Owner
Home Financials are based on the most recent Mortgage that was taken out on this home.
Original Mortgage
$80,000
Interest Rate
4.42%
Mortgage Type
New Conventional
Purchase Details
Closed on
Nov 4, 2005
Sold by
Magee Joe and Magee Peggy Louise
Bought by
Newton David Scott and Hardiosn Marlene E
Create a Home Valuation Report for This Property
The Home Valuation Report is an in-depth analysis detailing your home's value as well as a comparison with similar homes in the area
Home Values in the Area
Average Home Value in this Area
Purchase History
| Date | Buyer | Sale Price | Title Company |
|---|---|---|---|
| Cahill Property Developments Llc | $80,000 | Chicago Title | |
| Dna Holdings Llc | $68,000 | Chicago Title | |
| Newton David Scott | -- | American Abstract & Title Co | |
| Newton David Scott | -- | None Available |
Source: Public Records
Mortgage History
| Date | Status | Borrower | Loan Amount |
|---|---|---|---|
| Previous Owner | Newton David Scott | $80,000 |
Source: Public Records
Tax History Compared to Growth
Tax History
| Year | Tax Paid | Tax Assessment Tax Assessment Total Assessment is a certain percentage of the fair market value that is determined by local assessors to be the total taxable value of land and additions on the property. | Land | Improvement |
|---|---|---|---|---|
| 2025 | $971 | $8,159 | $764 | $7,395 |
| 2024 | $1,164 | $9,572 | $1,440 | $8,132 |
| 2023 | $1,164 | $9,116 | $1,440 | $7,676 |
| 2022 | $997 | $8,682 | $1,440 | $7,242 |
| 2021 | $981 | $8,269 | $1,440 | $6,829 |
| 2020 | $929 | $7,875 | $1,440 | $6,435 |
| 2019 | $889 | $7,500 | $1,440 | $6,060 |
| 2018 | $823 | $6,803 | $2,394 | $4,409 |
| 2017 | $780 | $6,479 | $2,317 | $4,162 |
| 2016 | $706 | $6,171 | $2,244 | $3,927 |
| 2015 | -- | $5,876 | $2,174 | $3,702 |
| 2014 | -- | $5,597 | $2,108 | $3,489 |
Source: Public Records
Map
Nearby Homes
- 119 E Ross Ave
- 1424 S Main St
- 211 E Wells Blvd
- 119 E Davis Ave
- 121 E Davis Ave
- 110 W Mill Ave
- 11 E Mill Ave
- 1220 S Cedar St
- 1965 S Scott St
- 2326 S Main St
- 1915 S Muskogee St
- 19 E Fairlane Ct
- 41 W Fairlane Ct
- 813 E Teresa Ave
- 910 S Diane St
- 103 E Fairlane Ct
- 724 S Main St
- 1103 S Division St
- 1109 S Division St
- 706 S Poplar St
- 1701 S Water St
- 705 S Water St
- 31311 S Water St
- 103 E Wells Blvd
- 107 E Wells Blvd
- 118 E Ross Ave
- 121 E Ross Ave
- 16 E Ross Ave
- 123 E Ross Ave
- 122 E Ross Ave
- 125 E Ross Ave
- 111 E Wells Blvd
- 118 E Burnham Ave
- 115 E Wells Blvd
- 1701 S Main St
- 127 E Ross Ave
- 1801 S Water St
- 121 E Wells Blvd
- 1800 S Ridgeway St
- 1700 S Park St