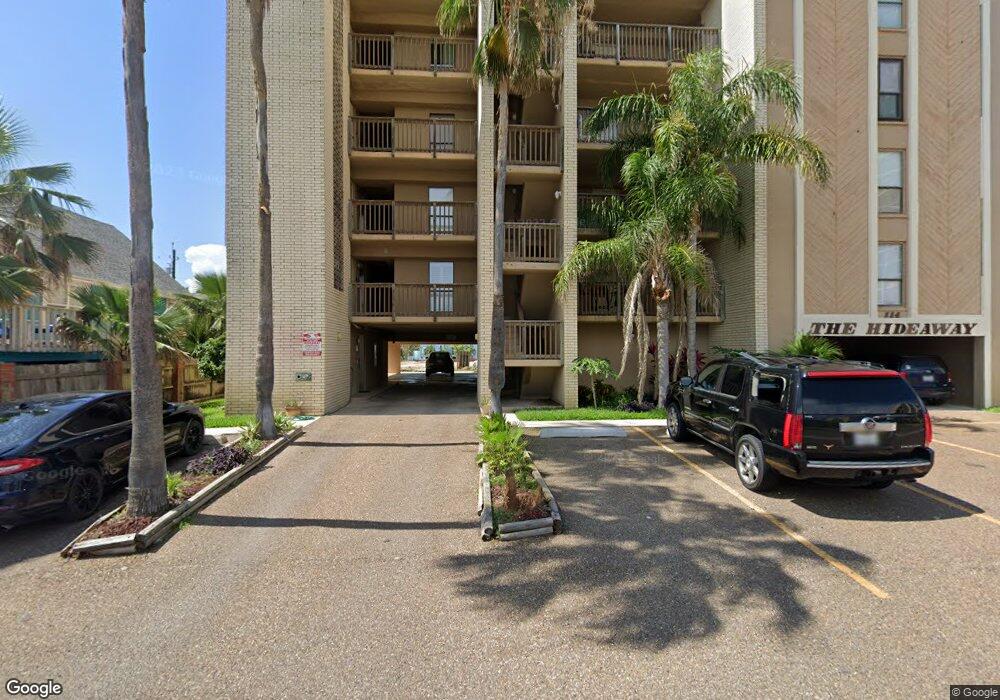
114 E Tarpon St Unit 302 South Padre Island, TX 78597
Estimated Value: $344,542 - $474,000
2
Beds
2
Baths
1,095
Sq Ft
$357/Sq Ft
Est. Value
About This Home
This home is located at 114 E Tarpon St Unit 302, South Padre Island, TX 78597 and is currently estimated at $390,886, approximately $356 per square foot. 114 E Tarpon St Unit 302 is a home located in Cameron County with nearby schools including Garriga Elementary School, Derry Elementary School, and Port Isabel Junior High School.
Ownership History
Date
Name
Owned For
Owner Type
Purchase Details
Closed on
Jul 30, 2021
Sold by
Rezutka Richard J and Rezutka Danette
Bought by
Silva Israel Jose and Silva Ella Gisel
Current Estimated Value
Home Financials for this Owner
Home Financials are based on the most recent Mortgage that was taken out on this home.
Original Mortgage
$179,999
Outstanding Balance
$138,542
Interest Rate
2.93%
Mortgage Type
New Conventional
Estimated Equity
$252,344
Purchase Details
Closed on
Jun 23, 2020
Sold by
F4cs Holdings Llc
Bought by
Rezutka Richard J and Rezutka Danette
Home Financials for this Owner
Home Financials are based on the most recent Mortgage that was taken out on this home.
Original Mortgage
$100,000
Interest Rate
3.2%
Mortgage Type
New Conventional
Purchase Details
Closed on
Oct 11, 2018
Sold by
Centinela Properties Lp
Bought by
F4cs Holdings Llc
Purchase Details
Closed on
Oct 10, 2005
Sold by
Garza Ana Lisa
Bought by
Centinela Properties Lp
Create a Home Valuation Report for This Property
The Home Valuation Report is an in-depth analysis detailing your home's value as well as a comparison with similar homes in the area
Home Values in the Area
Average Home Value in this Area
Purchase History
| Date | Buyer | Sale Price | Title Company |
|---|---|---|---|
| Silva Israel Jose | -- | Edwards Abstract | |
| Rezutka Richard J | -- | None Available | |
| F4cs Holdings Llc | -- | None Available | |
| Centinela Properties Lp | -- | -- |
Source: Public Records
Mortgage History
| Date | Status | Borrower | Loan Amount |
|---|---|---|---|
| Open | Silva Israel Jose | $179,999 | |
| Previous Owner | Rezutka Richard J | $100,000 |
Source: Public Records
Tax History Compared to Growth
Tax History
| Year | Tax Paid | Tax Assessment Tax Assessment Total Assessment is a certain percentage of the fair market value that is determined by local assessors to be the total taxable value of land and additions on the property. | Land | Improvement |
|---|---|---|---|---|
| 2025 | $6,094 | $364,513 | $37,499 | $327,014 |
| 2024 | $6,094 | $373,217 | $37,499 | $335,718 |
| 2023 | $5,444 | $317,517 | $37,499 | $280,018 |
| 2022 | $3,979 | $210,012 | $29,166 | $180,846 |
| 2021 | $3,854 | $191,614 | $21,874 | $169,740 |
| 2020 | $2,508 | $123,836 | $21,874 | $101,962 |
| 2019 | $2,601 | $125,980 | $20,833 | $105,147 |
| 2018 | $2,665 | $129,167 | $20,833 | $108,334 |
| 2017 | $2,677 | $130,760 | $20,833 | $109,927 |
| 2016 | $2,710 | $132,353 | $20,833 | $111,520 |
| 2015 | $2,737 | $135,539 | $20,833 | $114,706 |
Source: Public Records
Map
Nearby Homes
- 115 E Marlin St Unit B
- 114 E Tarpon St Unit 201
- 104 E Tarpon St
- 104 E Tarpon St Unit 1-4
- 111 E Tarpon St
- 102 E Tarpon St
- 102 E Marlin St Unit 11
- 2401 Gulf Blvd Unit 214
- 107 E Ling St Unit 108
- 2100 Gulf Blvd Unit 1003
- 2100 Gulf Blvd Unit 404
- 2100 Gulf Blvd
- 2100 Gulf Blvd Unit 1005
- 113 E Pike St Unit 5
- 113 E Pike St Unit 11
- 109 E Pompano St
- 107 Pike St
- 108 E Sheepshead St
- 105 E Pike St
- 122 E Pike St Unit 22
- 114 E Tarpon St Unit 301
- 114 E Tarpon St Unit 203
- 114 E Tarpon St
- 114 E Tarpon St Unit 103
- 114 E Tarpon St Unit 402
- 114 E Tarpon St Unit 101
- 114 E Tarpon St Unit 403
- 114 E Tarpon St Unit 202
- 114 E Tarpon St Unit 303
- 114 E Tarpon St Unit 102
- 102 Hideaway
- 2201 Gulf Blvd
- 112 E Tarpon St Unit 18
- 112 E Tarpon St
- 117 E Marlin St Unit B
- 117 E Marlin St Unit C
- 119 E Marlin St
- 115-119 E Marlin St
- 115-119 E Marlin St Unit 12-14
- 115 E Marlin St Unit C