Estimated Value: $155,000 - $182,000
2
Beds
2
Baths
1,150
Sq Ft
$151/Sq Ft
Est. Value
About This Home
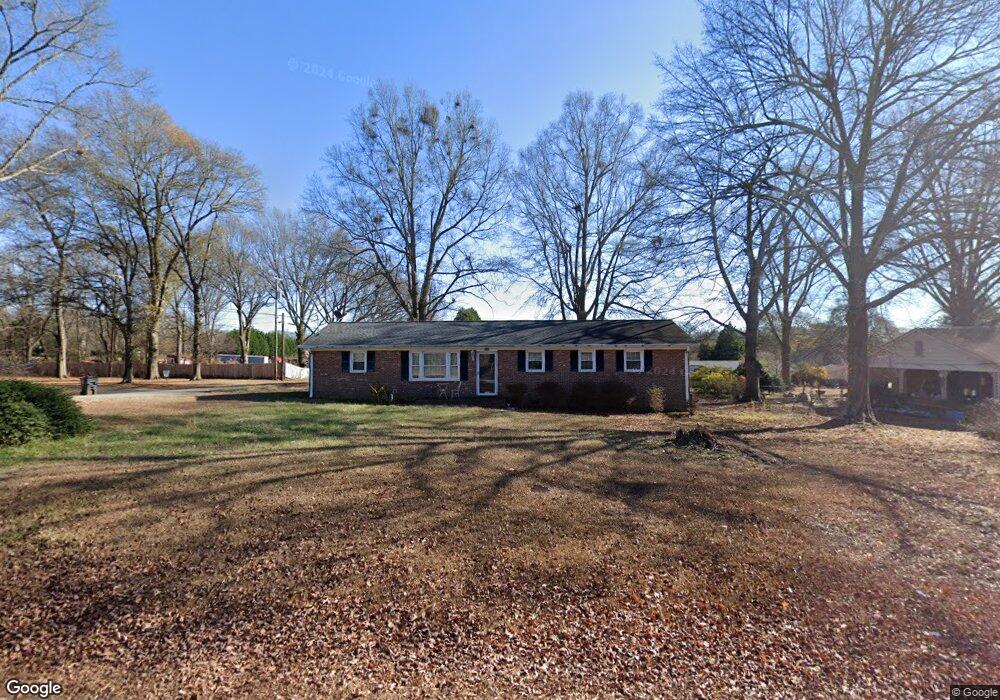
This home is located at 114 Elberta St, Inman, SC 29349 and is currently estimated at $173,334, approximately $150 per square foot. 114 Elberta St is a home located in Spartanburg County with nearby schools including Inman Elementary School, T.E. Mabry Middle School, and Chapman High School.
Ownership History
Date
Name
Owned For
Owner Type
Purchase Details
Closed on
Nov 6, 2020
Sold by
Allen Smith Kelvin
Bought by
Raines Joshua M
Current Estimated Value
Home Financials for this Owner
Home Financials are based on the most recent Mortgage that was taken out on this home.
Original Mortgage
$96,224
Outstanding Balance
$85,626
Interest Rate
2.8%
Mortgage Type
FHA
Estimated Equity
$87,708
Purchase Details
Closed on
Mar 16, 2015
Sold by
Smith Barbara G
Bought by
Smith Kelvin Allen and Smith Barbara G
Create a Home Valuation Report for This Property
The Home Valuation Report is an in-depth analysis detailing your home's value as well as a comparison with similar homes in the area
Home Values in the Area
Average Home Value in this Area
Purchase History
| Date | Buyer | Sale Price | Title Company |
|---|---|---|---|
| Raines Joshua M | $98,000 | None Listed On Document | |
| Smith Kelvin Allen | -- | -- |
Source: Public Records
Mortgage History
| Date | Status | Borrower | Loan Amount |
|---|---|---|---|
| Open | Raines Joshua M | $96,224 |
Source: Public Records
Tax History Compared to Growth
Tax History
| Year | Tax Paid | Tax Assessment Tax Assessment Total Assessment is a certain percentage of the fair market value that is determined by local assessors to be the total taxable value of land and additions on the property. | Land | Improvement |
|---|---|---|---|---|
| 2025 | $1,198 | $4,655 | $1,302 | $3,353 |
| 2024 | $1,198 | $4,655 | $1,302 | $3,353 |
| 2023 | $1,198 | $4,655 | $1,302 | $3,353 |
| 2022 | $1,035 | $4,048 | $1,036 | $3,012 |
| 2021 | $1,015 | $4,048 | $1,036 | $3,012 |
| 2020 | $2,877 | $6,072 | $1,554 | $4,518 |
| 2019 | $535 | $4,048 | $1,036 | $3,012 |
| 2018 | $529 | $4,048 | $1,036 | $3,012 |
| 2017 | $412 | $3,588 | $1,036 | $2,552 |
| 2016 | $400 | $3,588 | $1,036 | $2,552 |
| 2015 | $395 | $3,588 | $1,036 | $2,552 |
| 2014 | $380 | $3,588 | $1,036 | $2,552 |
Source: Public Records
Map
Nearby Homes
- 140 Golightly St
- 42 Bishop St
- 119 Beechwood Dr
- 0 Johnson Ave
- 704 Adaline Dr
- 14 Littlefield St
- 415 Grady Dr
- 155 Wingo St
- 9041 Asheville Hwy
- 9038 Legendary Ln
- 7 Lawrence St
- 8 Bobo St
- 10 A St
- 102 Gary Dr
- 00 Bomar St
- 28 Blackstock Rd
- 107 Denali St
- 135 Glendarosa Dr
- Heatherwood Plan at Stones Throw
- Inman Plan at Stones Throw