114 Epworth St Worcester, MA 01610
North Quinsigamond Village NeighborhoodEstimated Value: $406,000 - $461,389
3
Beds
3
Baths
1,560
Sq Ft
$284/Sq Ft
Est. Value
About This Home
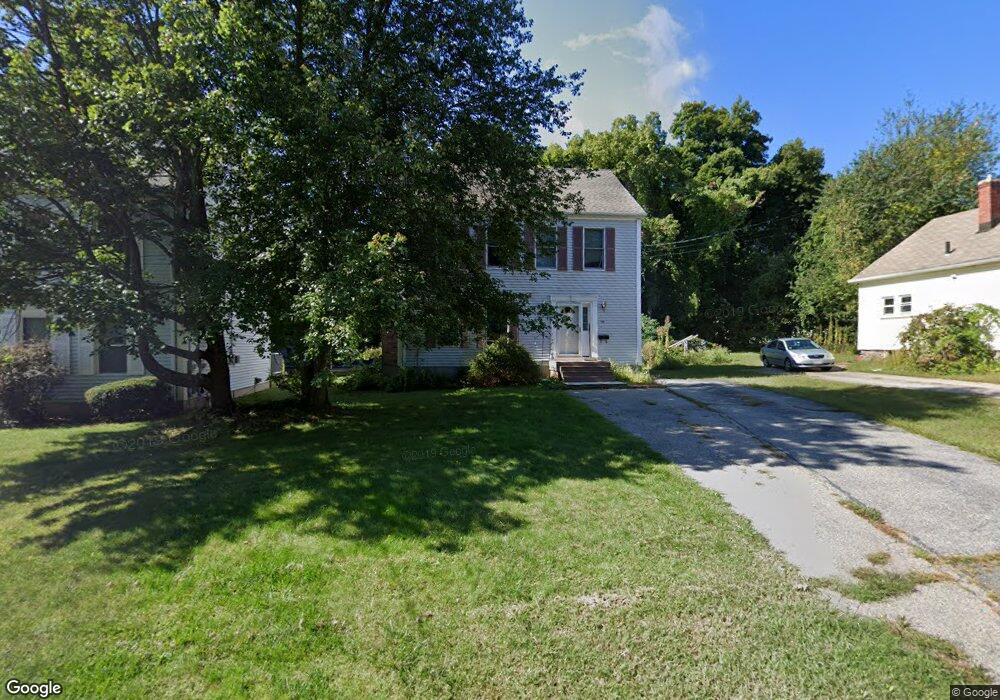
This home is located at 114 Epworth St, Worcester, MA 01610 and is currently estimated at $443,597, approximately $284 per square foot. 114 Epworth St is a home located in Worcester County with nearby schools including Quinsigamond School, Jacob Hiatt Magnet School, and Chandler Magnet.
Ownership History
Date
Name
Owned For
Owner Type
Purchase Details
Closed on
Oct 1, 2001
Sold by
Holmes David N and Holmes Nan I
Bought by
Alves Luke D and Alves Annmarie
Current Estimated Value
Home Financials for this Owner
Home Financials are based on the most recent Mortgage that was taken out on this home.
Original Mortgage
$169,100
Outstanding Balance
$66,289
Interest Rate
6.91%
Mortgage Type
Purchase Money Mortgage
Estimated Equity
$377,308
Purchase Details
Closed on
Jan 19, 1989
Sold by
Babine Brian C
Bought by
Holmes David
Home Financials for this Owner
Home Financials are based on the most recent Mortgage that was taken out on this home.
Original Mortgage
$130,500
Interest Rate
10.38%
Mortgage Type
Purchase Money Mortgage
Create a Home Valuation Report for This Property
The Home Valuation Report is an in-depth analysis detailing your home's value as well as a comparison with similar homes in the area
Home Values in the Area
Average Home Value in this Area
Purchase History
| Date | Buyer | Sale Price | Title Company |
|---|---|---|---|
| Alves Luke D | $178,000 | -- | |
| Holmes David | $145,000 | -- |
Source: Public Records
Mortgage History
| Date | Status | Borrower | Loan Amount |
|---|---|---|---|
| Open | Holmes David | $169,100 | |
| Previous Owner | Holmes David | $130,500 |
Source: Public Records
Tax History Compared to Growth
Tax History
| Year | Tax Paid | Tax Assessment Tax Assessment Total Assessment is a certain percentage of the fair market value that is determined by local assessors to be the total taxable value of land and additions on the property. | Land | Improvement |
|---|---|---|---|---|
| 2025 | $5,182 | $392,900 | $117,800 | $275,100 |
| 2024 | $5,088 | $370,000 | $117,800 | $252,200 |
| 2023 | $4,967 | $346,400 | $102,500 | $243,900 |
| 2022 | $4,577 | $300,900 | $82,000 | $218,900 |
| 2021 | $4,386 | $269,400 | $65,600 | $203,800 |
| 2020 | $4,260 | $250,600 | $65,600 | $185,000 |
| 2019 | $4,100 | $227,800 | $59,000 | $168,800 |
| 2018 | $4,075 | $215,500 | $59,000 | $156,500 |
| 2017 | $3,927 | $204,300 | $59,000 | $145,300 |
| 2016 | $3,873 | $187,900 | $43,000 | $144,900 |
| 2015 | $3,771 | $187,900 | $43,000 | $144,900 |
| 2014 | $3,672 | $187,900 | $43,000 | $144,900 |
Source: Public Records
Map
Nearby Homes