114 Freeman St Ardmore, OK 73401
Estimated Value: $60,000 - $134,000
2
Beds
1
Bath
1,166
Sq Ft
$85/Sq Ft
Est. Value
About This Home
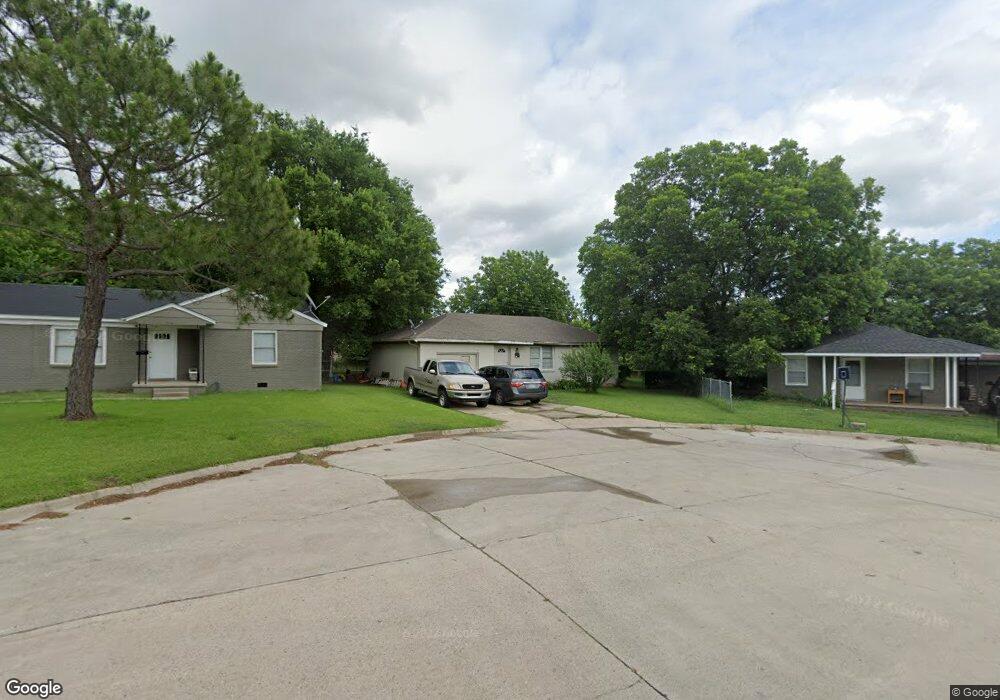
This home is located at 114 Freeman St, Ardmore, OK 73401 and is currently estimated at $99,338, approximately $85 per square foot. 114 Freeman St is a home located in Carter County with nearby schools including Charles Evans Elementary School, Ardmore Middle School, and Ardmore High School.
Ownership History
Date
Name
Owned For
Owner Type
Purchase Details
Closed on
Apr 8, 2022
Sold by
John Baxter Billy and John Kathy
Bought by
White Rock Investments Llc
Current Estimated Value
Purchase Details
Closed on
Jul 22, 2013
Sold by
Burroughs Michael A and Burroughs Michael Avery
Bought by
Burroughs Brannon R
Home Financials for this Owner
Home Financials are based on the most recent Mortgage that was taken out on this home.
Original Mortgage
$43,500
Interest Rate
3.99%
Mortgage Type
Unknown
Purchase Details
Closed on
Mar 17, 2005
Sold by
Cargal Hoyt C and Cargal Julia N
Bought by
Burroughs Michael A and Burroughs Leann L
Home Financials for this Owner
Home Financials are based on the most recent Mortgage that was taken out on this home.
Original Mortgage
$32,975
Interest Rate
5.66%
Mortgage Type
FHA
Purchase Details
Closed on
Jan 14, 1998
Sold by
Midfirst Bank
Bought by
Secretary Of Veterans Aff
Purchase Details
Closed on
Aug 28, 1997
Sold by
Wall Stephen G
Bought by
Midfirst Bank
Purchase Details
Closed on
Sep 24, 1993
Sold by
Boston Donald
Bought by
Wall Stephen G
Create a Home Valuation Report for This Property
The Home Valuation Report is an in-depth analysis detailing your home's value as well as a comparison with similar homes in the area
Purchase History
| Date | Buyer | Sale Price | Title Company |
|---|---|---|---|
| White Rock Investments Llc | $12,000 | Arbuckle Closing & Escrow | |
| Burroughs Brannon R | $30,000 | None Available | |
| Burroughs Michael A | $33,000 | -- | |
| Secretary Of Veterans Aff | -- | -- | |
| Midfirst Bank | -- | -- | |
| Wall Stephen G | -- | -- |
Source: Public Records
Mortgage History
| Date | Status | Borrower | Loan Amount |
|---|---|---|---|
| Previous Owner | Burroughs Brannon R | $43,500 | |
| Previous Owner | Burroughs Michael A | $32,975 |
Source: Public Records
Tax History
| Year | Tax Paid | Tax Assessment Tax Assessment Total Assessment is a certain percentage of the fair market value that is determined by local assessors to be the total taxable value of land and additions on the property. | Land | Improvement |
|---|---|---|---|---|
| 2025 | $551 | $5,527 | $788 | $4,739 |
| 2024 | $552 | $5,264 | $751 | $4,513 |
| 2023 | $525 | $5,013 | $705 | $4,308 |
| 2022 | $456 | $4,774 | $652 | $4,122 |
| 2021 | $459 | $4,547 | $603 | $3,944 |
| 2020 | $431 | $4,330 | $543 | $3,787 |
| 2019 | $400 | $4,124 | $518 | $3,606 |
| 2018 | $388 | $3,928 | $493 | $3,435 |
| 2017 | $342 | $3,741 | $401 | $3,340 |
| 2016 | $332 | $3,563 | $434 | $3,129 |
| 2015 | $261 | $3,393 | $420 | $2,973 |
| 2014 | $289 | $3,232 | $420 | $2,812 |
Source: Public Records
Map
Nearby Homes
- 11 Turner St
- 206 Allen Dr
- 25 Hillcrest St
- 111 Lost Creek Ln
- 1618 Mount Washington Rd
- 412 Wandering Way
- 1722 Quiet Ln
- 205 15th Ave NW
- 1409 Mount Washington Rd
- 1740 Tiverton St
- 1415 Holt St
- 421 Elm St
- 230 13th Ave NW
- 1228 D St NW
- 209 11th Ave NW
- 116 11th Ave NW
- 414 Locust St
- 4015 Hwy 177
- 113 10th Ave NE
- 0 NE 10th Ave Unit 2517786
Your Personal Tour Guide
Ask me questions while you tour the home.