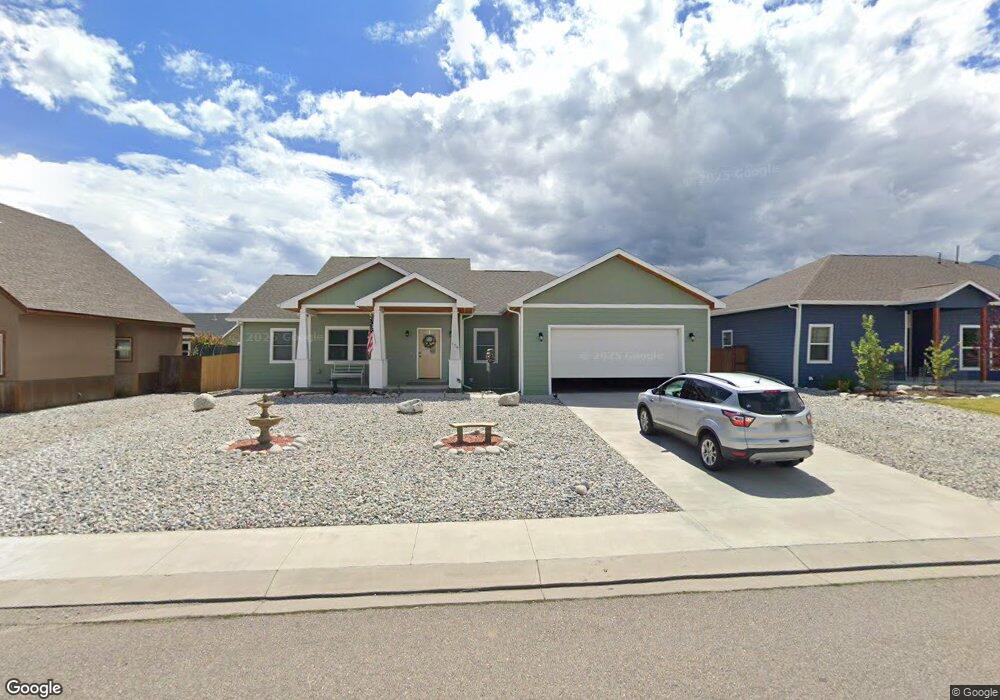
114 Grouse Rd Buena Vista, CO 81211
Estimated Value: $676,971 - $730,000
3
Beds
2
Baths
1,654
Sq Ft
$424/Sq Ft
Est. Value
About This Home
This home is located at 114 Grouse Rd, Buena Vista, CO 81211 and is currently estimated at $700,493, approximately $423 per square foot. 114 Grouse Rd is a home located in Chaffee County with nearby schools including Avery/Parsons Elementary School, Buena Vista Middle School, and Chaffee County High School.
Ownership History
Date
Name
Owned For
Owner Type
Purchase Details
Closed on
Feb 9, 2018
Sold by
Jones Richard E and Barille Susan E
Bought by
Dahn Teri L
Current Estimated Value
Purchase Details
Closed on
Feb 14, 2017
Sold by
Jones Richard E
Bought by
Jones Richard E and Barrille Susan E
Purchase Details
Closed on
Jul 25, 2016
Sold by
Eagles Roost Investments Llc
Bought by
Jones Richard E
Purchase Details
Closed on
Jul 11, 2016
Sold by
Reese Jodi
Bought by
Eagles Roost Investments Llc
Purchase Details
Closed on
Feb 25, 2015
Sold by
Reese Jodi
Bought by
Eagles Roost Investments Llc
Purchase Details
Closed on
Feb 27, 2014
Sold by
Moodscapes Llc
Bought by
Eagles Roost Living Trust
Purchase Details
Closed on
Jan 10, 2014
Sold by
Colorado East Bank & Trust
Bought by
Moodscapes Llc
Create a Home Valuation Report for This Property
The Home Valuation Report is an in-depth analysis detailing your home's value as well as a comparison with similar homes in the area
Home Values in the Area
Average Home Value in this Area
Purchase History
| Date | Buyer | Sale Price | Title Company |
|---|---|---|---|
| Dahn Teri L | $335,000 | None Available | |
| Jones Richard E | -- | None Available | |
| Jones Richard E | $37,000 | None Available | |
| Eagles Roost Investments Llc | -- | None Available | |
| Eagles Roost Investments Llc | -- | None Available | |
| Eagles Roost Living Trust | $16,000 | Agent For Commonwealth Land | |
| Eagles Roost Living Trust | $16,000 | Agent For Commonwealth Land | |
| Moodscapes Llc | $11,500 | None Available |
Source: Public Records
Tax History Compared to Growth
Tax History
| Year | Tax Paid | Tax Assessment Tax Assessment Total Assessment is a certain percentage of the fair market value that is determined by local assessors to be the total taxable value of land and additions on the property. | Land | Improvement |
|---|---|---|---|---|
| 2024 | $2,192 | $41,170 | $7,510 | $33,660 |
| 2023 | $2,066 | $41,170 | $7,510 | $33,660 |
| 2022 | $1,712 | $30,080 | $3,540 | $26,540 |
| 2021 | $1,712 | $30,950 | $3,650 | $27,300 |
| 2020 | $1,587 | $26,730 | $2,970 | $23,760 |
| 2019 | $1,582 | $26,730 | $2,970 | $23,760 |
| 2018 | $1,386 | $21,540 | $2,520 | $19,020 |
| 2017 | $598 | $10,150 | $10,150 | $0 |
| 2016 | $258 | $4,810 | $4,810 | $0 |
| 2015 | $215 | $4,810 | $4,810 | $0 |
| 2014 | $215 | $3,500 | $0 | $0 |
Source: Public Records
Map
Nearby Homes
- 117 Red Tail Blvd
- 125 Raven Way
- 104 Red Tail Blvd
- 105 Eagle Dr Unit 85
- 118 Eagle Dr Unit 98
- 106 Eagle Dr Unit 104
- 117 Eagle Dr Unit 91
- 129 Red Tail Blvd
- 84 Kathy Dr
- 136 Raven Way Unit 158
- 170 Larissa Ln Unit C
- 146 Raven Way
- 164 Larissa Ln Unit A
- 130 Windwalker Rd
- 15627 Paintbrush St
- 0 S Sangre de Cristo Ave Unit 11 REC4938082
- 149 S Sangre de Cristo Ave
- 1004 W Main St Unit 5
- 1004 W Main St Unit 4
- 1004 W Main St Unit 3
- 116 Grouse Rd
- 112 Grouse Rd
- 113 Red Tail Blvd
- 115 Red Tail Blvd
- 111 Red Tail Blvd
- 113 Grouse Rd
- 118 Grouse Rd
- 111 Grouse Rd
- 115 Grouse Rd
- 110 Grouse Rd
- 109 Red Tail Blvd
- 117 117 Grouse Rd
- 117 Grouse Rd
- 109 Grouse Rd
- 116 Raven Way
- 114 Red Tail Blvd
- 118 Raven Way
- 112 Red Tail Blvd
- 114 Raven Way
- 116 Red Tail Blvd