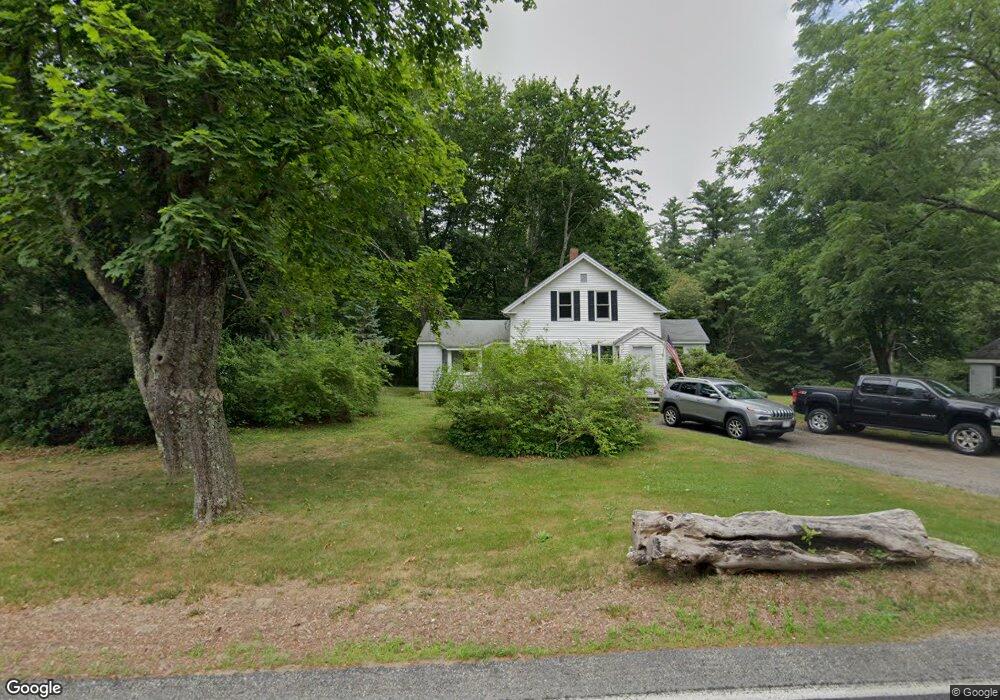
114 High St Carver, MA 02330
Estimated Value: $494,000 - $541,000
3
Beds
1
Bath
1,365
Sq Ft
$379/Sq Ft
Est. Value
About This Home
This home is located at 114 High St, Carver, MA 02330 and is currently estimated at $517,245, approximately $378 per square foot. 114 High St is a home located in Plymouth County with nearby schools including Carver Elementary School, Carver Middle/High School, and Sacred Heart High School.
Ownership History
Date
Name
Owned For
Owner Type
Purchase Details
Closed on
Mar 22, 2021
Sold by
Davenport Bcch Llc
Bought by
Henny Lane Llc
Current Estimated Value
Purchase Details
Closed on
Sep 26, 2006
Sold by
Cranberry Jennifer May
Bought by
Mooney Peter J and Acorn Deborah
Home Financials for this Owner
Home Financials are based on the most recent Mortgage that was taken out on this home.
Original Mortgage
$235,000
Interest Rate
6.59%
Mortgage Type
Purchase Money Mortgage
Create a Home Valuation Report for This Property
The Home Valuation Report is an in-depth analysis detailing your home's value as well as a comparison with similar homes in the area
Home Values in the Area
Average Home Value in this Area
Purchase History
| Date | Buyer | Sale Price | Title Company |
|---|---|---|---|
| Henny Lane Llc | $2,350,000 | None Available | |
| Mooney Peter J | $255,000 | -- |
Source: Public Records
Mortgage History
| Date | Status | Borrower | Loan Amount |
|---|---|---|---|
| Previous Owner | Mooney Peter J | $235,000 | |
| Previous Owner | Mooney Peter J | $100,000 |
Source: Public Records
Tax History
| Year | Tax Paid | Tax Assessment Tax Assessment Total Assessment is a certain percentage of the fair market value that is determined by local assessors to be the total taxable value of land and additions on the property. | Land | Improvement |
|---|---|---|---|---|
| 2025 | $5,810 | $418,900 | $154,900 | $264,000 |
| 2024 | $5,538 | $390,800 | $151,900 | $238,900 |
| 2023 | $5,387 | $369,200 | $151,900 | $217,300 |
| 2022 | $5,088 | $318,400 | $129,900 | $188,500 |
| 2021 | $4,867 | $287,300 | $116,000 | $171,300 |
| 2020 | $4,643 | $270,100 | $108,400 | $161,700 |
| 2019 | $4,481 | $262,800 | $105,200 | $157,600 |
| 2018 | $4,379 | $248,400 | $105,200 | $143,200 |
| 2017 | $3,458 | $232,100 | $101,200 | $130,900 |
| 2016 | $3,782 | $222,100 | $96,400 | $125,700 |
| 2015 | $3,655 | $214,900 | $96,400 | $118,500 |
| 2014 | $3,783 | $222,400 | $121,900 | $100,500 |
Source: Public Records
Map
Nearby Homes
- 0 Spring St
- 125 Brook St
- 11 Brockton Ave
- 42 Christmas Tree Ln
- 6 Twin Pines Ln Unit 6
- 25 Dukes Brook Rd
- 26 Santana Way Unit 26
- 13 Pond View Way
- 56 Bunnys Rd
- 81 Center St
- 35 Silva St
- 103 Esta Rd
- 241 Carver Rd Unit 7
- 61 Esta Rd
- 25 Old Center St
- 34 Surrey Dr
- 6 Coachman Terrace
- 10 Coachman Terrace
- 12 Meeting House Rd
- 1 Pinehurst Dr
Your Personal Tour Guide
Ask me questions while you tour the home.