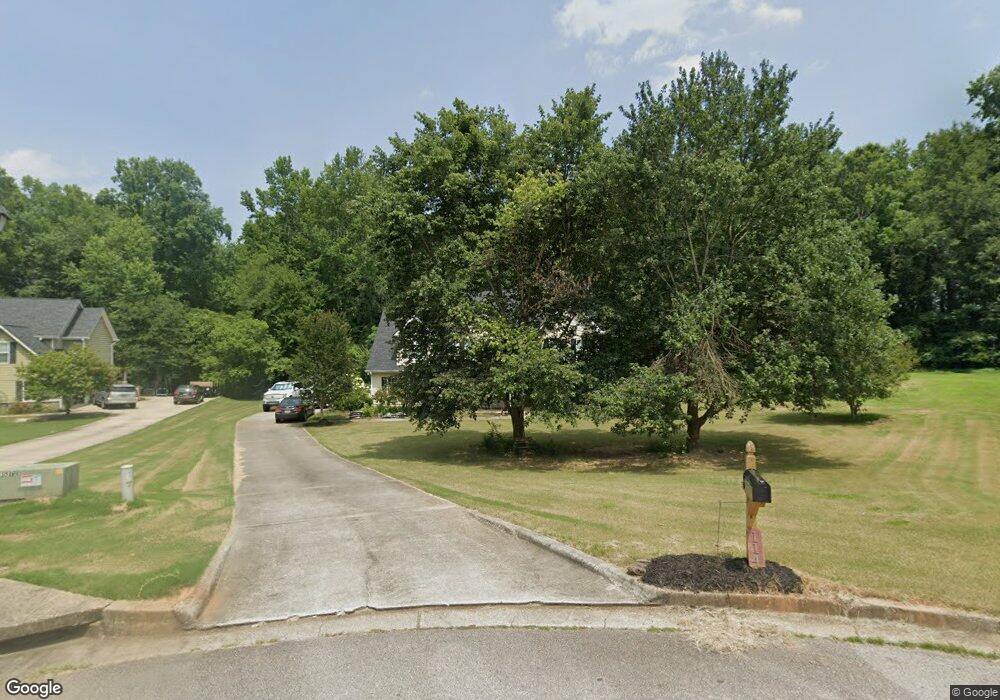
114 Jacksons Walk Jefferson, GA 30549
Estimated Value: $394,000 - $460,000
Studio
3
Baths
2,402
Sq Ft
$177/Sq Ft
Est. Value
About This Home
This home is located at 114 Jacksons Walk, Jefferson, GA 30549 and is currently estimated at $424,610, approximately $176 per square foot. 114 Jacksons Walk is a home located in Jackson County with nearby schools including South Jackson Elementary School, East Jackson Middle School, and East Jackson Comprehensive High School.
Ownership History
Date
Name
Owned For
Owner Type
Purchase Details
Closed on
May 4, 2011
Sold by
Federal Home Loan Mortgage
Bought by
Norris Jayson David
Current Estimated Value
Purchase Details
Closed on
Mar 4, 2011
Sold by
Federal Home Loan Mortgage Corporation
Bought by
Norris Jayson David
Home Financials for this Owner
Home Financials are based on the most recent Mortgage that was taken out on this home.
Original Mortgage
$132,552
Interest Rate
4.75%
Mortgage Type
FHA
Purchase Details
Closed on
Mar 2, 2010
Sold by
Wells Fargo Bank Na
Bought by
Federal Home Loan Mortgage
Purchase Details
Closed on
Aug 13, 2004
Sold by
Rackley Construction Inc
Bought by
Daniel Vincent E
Purchase Details
Closed on
Jun 27, 2003
Sold by
Thompson Russell D
Bought by
Rackley Construction Inc
Purchase Details
Closed on
Jan 8, 2003
Sold by
Cooper Mary A
Bought by
Thompson Russell D
Create a Home Valuation Report for This Property
The Home Valuation Report is an in-depth analysis detailing your home's value as well as a comparison with similar homes in the area
Home Values in the Area
Average Home Value in this Area
Purchase History
| Date | Buyer | Sale Price | Title Company |
|---|---|---|---|
| Norris Jayson David | $136,000 | -- | |
| Norris Jayson David | -- | -- | |
| Federal Home Loan Mortgage | -- | -- | |
| Daniel Vincent E | $171,000 | -- | |
| Rackley Construction Inc | $112,000 | -- | |
| Thompson Russell D | $83,500 | -- |
Source: Public Records
Mortgage History
| Date | Status | Borrower | Loan Amount |
|---|---|---|---|
| Previous Owner | Norris Jayson David | $132,552 |
Source: Public Records
Map
Nearby Homes
- 100 Jacksons Walk
- 117 Jacksons Walk Unit 6
- 117 Jacksons Walk
- 109 Jacksons Walk
- 72 Jacksons Walk
- 87 Jacksons Walk Unit 4
- 3909 Winder Hwy
- 48 Jacksons Walk
- 61 Jacksons Walk
- 1180 Jackson Trail Rd
- 001 Hwy 11
- 33 Jacksons Walk
- 2 Jacksons Walk
- 1164 Jackson Trail Rd
- 26 Jacksons Walk Unit 11
- 26 Jacksons Walk
- 15 Jacksons Walk
- 14 Sparrow Ln
- 1295 Jackson Trail Rd
- 4077 Winder Hwy
Your Personal Tour Guide
Ask me questions while you tour the home.