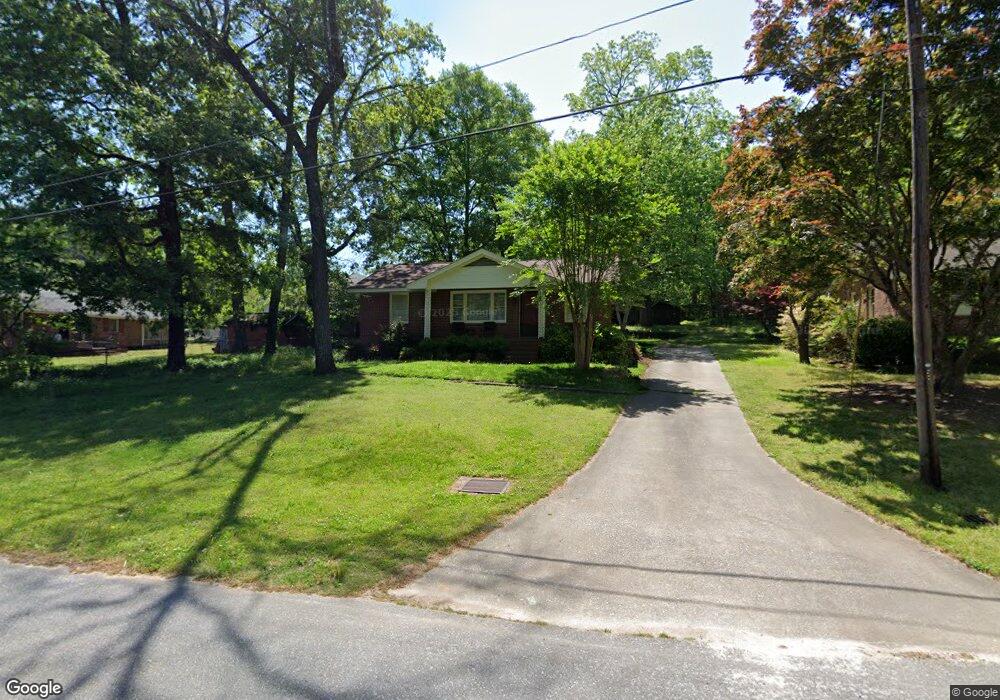
114 Langford St Winder, GA 30680
Estimated Value: $217,951 - $272,000
2
Beds
1
Bath
975
Sq Ft
$247/Sq Ft
Est. Value
About This Home
This home is located at 114 Langford St, Winder, GA 30680 and is currently estimated at $240,988, approximately $247 per square foot. 114 Langford St is a home located in Barrow County with nearby schools including County Line Elementary School, Russell Middle School, and Winder-Barrow High School.
Ownership History
Date
Name
Owned For
Owner Type
Purchase Details
Closed on
Aug 28, 2003
Sold by
Gunby Jason A
Bought by
Gunby Doris B and Gunby Peter
Current Estimated Value
Home Financials for this Owner
Home Financials are based on the most recent Mortgage that was taken out on this home.
Original Mortgage
$62,000
Interest Rate
5.72%
Mortgage Type
New Conventional
Purchase Details
Closed on
Nov 22, 2000
Sold by
Munday Karen R
Bought by
Gunby Jason A
Home Financials for this Owner
Home Financials are based on the most recent Mortgage that was taken out on this home.
Original Mortgage
$66,500
Interest Rate
7.87%
Mortgage Type
New Conventional
Purchase Details
Closed on
May 26, 1987
Sold by
Munday Eric D and Munday Kare
Bought by
Munday Karen R
Purchase Details
Closed on
Jul 10, 1980
Bought by
Munday Eric D and Munday Kare
Create a Home Valuation Report for This Property
The Home Valuation Report is an in-depth analysis detailing your home's value as well as a comparison with similar homes in the area
Home Values in the Area
Average Home Value in this Area
Purchase History
| Date | Buyer | Sale Price | Title Company |
|---|---|---|---|
| Gunby Doris B | $77,500 | -- | |
| Gunby Jason A | $70,000 | -- | |
| Munday Karen R | -- | -- | |
| Munday Eric D | $24,500 | -- |
Source: Public Records
Mortgage History
| Date | Status | Borrower | Loan Amount |
|---|---|---|---|
| Closed | Gunby Doris B | $62,000 | |
| Previous Owner | Gunby Jason A | $66,500 |
Source: Public Records
Tax History Compared to Growth
Tax History
| Year | Tax Paid | Tax Assessment Tax Assessment Total Assessment is a certain percentage of the fair market value that is determined by local assessors to be the total taxable value of land and additions on the property. | Land | Improvement |
|---|---|---|---|---|
| 2024 | $1,680 | $58,540 | $20,000 | $38,540 |
| 2023 | $1,963 | $58,540 | $20,000 | $38,540 |
| 2022 | $1,509 | $42,594 | $18,000 | $24,594 |
| 2021 | $1,305 | $34,156 | $14,400 | $19,756 |
| 2020 | $1,204 | $32,542 | $14,400 | $18,142 |
| 2019 | $1,074 | $28,130 | $11,600 | $16,530 |
| 2018 | $1,071 | $28,130 | $11,600 | $16,530 |
| 2017 | $685 | $22,950 | $8,000 | $14,950 |
| 2016 | $808 | $22,950 | $8,000 | $14,950 |
| 2015 | $809 | $22,950 | $8,000 | $14,950 |
| 2014 | $730 | $20,438 | $5,488 | $14,950 |
| 2013 | -- | $19,710 | $5,488 | $14,222 |
Source: Public Records
Map
Nearby Homes
- 326 Miles Patrick Rd
- 303 Rocky Point Ct
- 172 Settle St
- 197 Buena Vista St
- 401 N 5th Ave
- 256 4th Ave
- 352 3rd Ave
- 254 Partridge Trail
- 217 Bellview St
- 171 Brookview Terrace
- 381 W Candler St
- 311 2nd Ave
- 27 Creekside Dr
- 253 3rd Ave
- 0 E Northcrest Dr Unit 10648147
- 436 Northcrest Dr
- 188 Melrose St
- 469 Plantation Dr
- 281 Springdale Dr
- 118 Langford St
- 270 W Midland Ave
- 270 W Midland Ave
- 278 W Midland Ave
- 122 Langford St
- 264 W Midland Ave
- 286 W Midland Ave
- 286 W Midland Ave Unit 286
- 128 Pine Cir
- 130 Pine Cir
- 256 W Midland Ave
- 275 W Midland Ave
- 275 W Midland Ave Unit 8
- 263 W Midland Ave
- 292 W Midland Ave
- 132 Pine Cir
- 252 W Midland Ave
- 269 W Midland Ave
- 250 W Midland Ave
- 275 Grove St