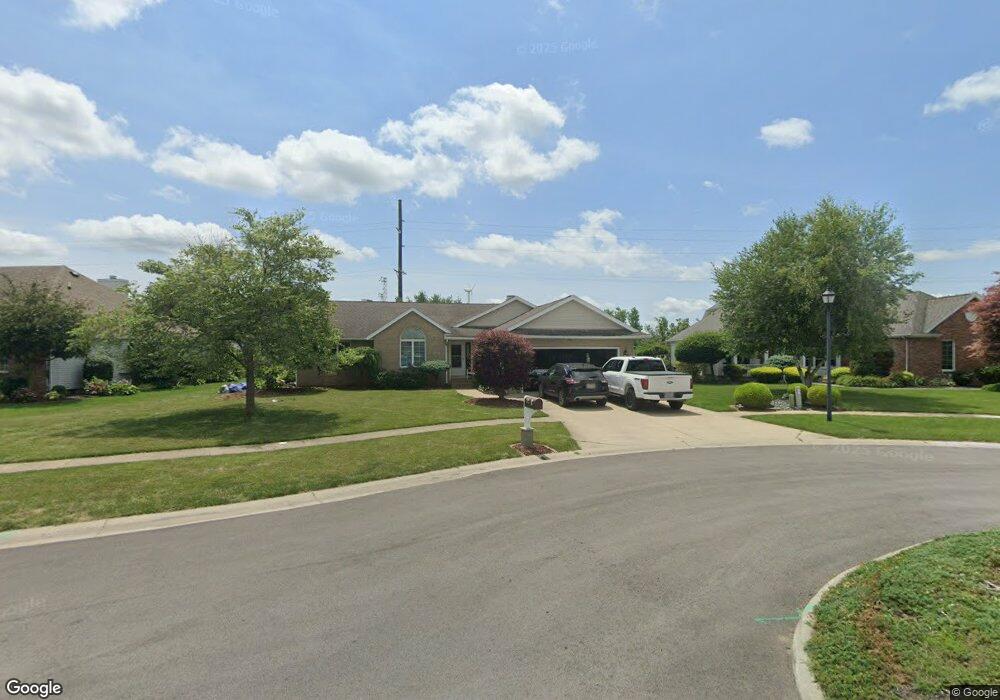
114 Larkspur Ct Bellevue, OH 44811
Estimated Value: $220,000 - $278,385
3
Beds
2
Baths
1,802
Sq Ft
$141/Sq Ft
Est. Value
About This Home
This home is located at 114 Larkspur Ct, Bellevue, OH 44811 and is currently estimated at $253,596, approximately $140 per square foot. 114 Larkspur Ct is a home located in Sandusky County with nearby schools including Bellevue Elementary School, Bellevue Middle School, and Bellevue High School.
Ownership History
Date
Name
Owned For
Owner Type
Purchase Details
Closed on
Jul 25, 2008
Sold by
Ruppert Roman J and Ruppert Marie
Bought by
Rizzo Brian L and Rizzo Jennifer M
Current Estimated Value
Home Financials for this Owner
Home Financials are based on the most recent Mortgage that was taken out on this home.
Original Mortgage
$174,500
Outstanding Balance
$114,698
Interest Rate
6.36%
Mortgage Type
Purchase Money Mortgage
Estimated Equity
$138,898
Purchase Details
Closed on
Jun 1, 2007
Sold by
Estate Of Thomas J Ruppert
Bought by
Ruppert Roman J
Purchase Details
Closed on
Jun 9, 2000
Sold by
Webb Dennis E
Bought by
Ruppert Thomas J
Home Financials for this Owner
Home Financials are based on the most recent Mortgage that was taken out on this home.
Original Mortgage
$160,000
Interest Rate
7.5%
Mortgage Type
New Conventional
Purchase Details
Closed on
May 17, 1995
Sold by
Miller Roger A
Bought by
Koch Earl E
Create a Home Valuation Report for This Property
The Home Valuation Report is an in-depth analysis detailing your home's value as well as a comparison with similar homes in the area
Home Values in the Area
Average Home Value in this Area
Purchase History
| Date | Buyer | Sale Price | Title Company |
|---|---|---|---|
| Rizzo Brian L | $179,625 | First American Title | |
| Ruppert Roman J | -- | Attorney | |
| Ruppert Thomas J | $181,000 | -- | |
| Koch Earl E | $25,900 | -- |
Source: Public Records
Mortgage History
| Date | Status | Borrower | Loan Amount |
|---|---|---|---|
| Open | Rizzo Brian L | $174,500 | |
| Previous Owner | Ruppert Thomas J | $160,000 |
Source: Public Records
Tax History Compared to Growth
Tax History
| Year | Tax Paid | Tax Assessment Tax Assessment Total Assessment is a certain percentage of the fair market value that is determined by local assessors to be the total taxable value of land and additions on the property. | Land | Improvement |
|---|---|---|---|---|
| 2024 | $3,411 | $79,770 | $12,740 | $67,030 |
| 2023 | $3,411 | $79,770 | $12,740 | $67,030 |
| 2022 | $3,650 | $75,040 | $12,740 | $62,300 |
| 2021 | $3,461 | $75,040 | $12,740 | $62,300 |
| 2020 | $3,022 | $61,920 | $12,740 | $49,180 |
| 2019 | $2,987 | $61,920 | $12,740 | $49,180 |
| 2018 | $2,938 | $61,920 | $12,740 | $49,180 |
| 2017 | $2,874 | $59,570 | $12,740 | $46,830 |
| 2016 | $2,779 | $59,570 | $12,740 | $46,830 |
| 2015 | $2,800 | $59,570 | $12,740 | $46,830 |
| 2014 | $3,021 | $61,500 | $12,810 | $48,690 |
| 2013 | $3,011 | $61,500 | $12,810 | $48,690 |
Source: Public Records
Map
Nearby Homes
- 219 Huffman St
- 130 Huffman St
- 124 Sunset Dr
- 819 Castalia St
- 808 Castalia St
- 303 Moore Ave
- 126 Greenwood Heights
- 408 W Main St
- 118 Maplewood
- 0 Oakwood Dr
- 150 Redwood Dr
- 0 County Road 308
- 230 Highland Ave Unit 106
- 231 Lawrence St
- 129 Hamilton St
- 154 Ashford Ave
- 206 Southwest St
- 155 Ashford Ave
- 140 Harkness St
- 1085 W Main St
- 100 Willow Dr
- 110 Larkspur Ct
- 100 Willow Ct
- 106 Larkspur Ct
- 121 Larkspur Terrace
- 101 Willow Dr
- 117 Larkspur Terrace
- 102 Larkspur Ct
- 101 Honeysuckle Dr
- 113 Larkspur Terrace
- 104 Willow Ct
- 105 Honeysuckle Dr
- 110 Larkspur Terrace
- 109 Honeysuckle Dr
- 108 Willow Ct
- 112 Willow Ct
- 109 Larkspur Terrace
- 113 Honeysuckle Dr
- 105 Larkspur Terrace
- 100 Honeysuckle Dr