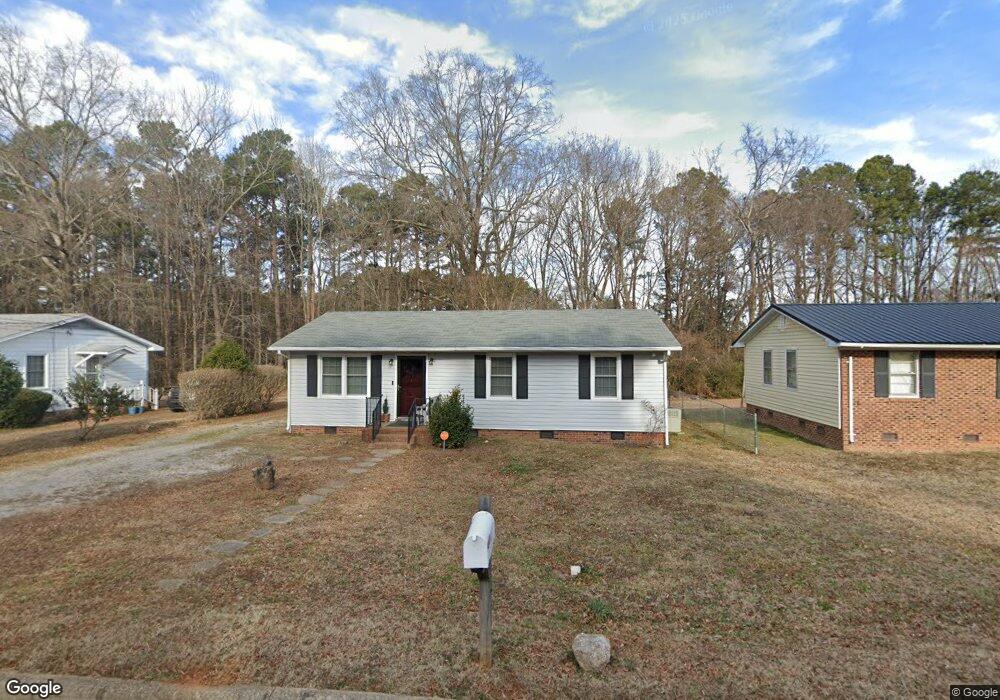
114 Leak Ave Oxford, NC 27565
Estimated Value: $130,492 - $186,000
--
Bed
1
Bath
1,000
Sq Ft
$157/Sq Ft
Est. Value
About This Home
This home is located at 114 Leak Ave, Oxford, NC 27565 and is currently estimated at $157,123, approximately $157 per square foot. 114 Leak Ave is a home located in Granville County with nearby schools including Stovall-Shaw Elementary School, Northern Granville Middle School, and Hill City High School.
Create a Home Valuation Report for This Property
The Home Valuation Report is an in-depth analysis detailing your home's value as well as a comparison with similar homes in the area
Home Values in the Area
Average Home Value in this Area
Tax History Compared to Growth
Tax History
| Year | Tax Paid | Tax Assessment Tax Assessment Total Assessment is a certain percentage of the fair market value that is determined by local assessors to be the total taxable value of land and additions on the property. | Land | Improvement |
|---|---|---|---|---|
| 2025 | $1,053 | $87,259 | $18,000 | $69,259 |
| 2024 | $1,053 | $87,259 | $18,000 | $69,259 |
| 2023 | $1,051 | $54,257 | $13,500 | $40,757 |
| 2022 | $894 | $54,257 | $13,500 | $40,757 |
| 2021 | $803 | $54,257 | $13,500 | $40,757 |
| 2020 | $137 | $54,257 | $13,500 | $40,757 |
| 2019 | $137 | $54,257 | $13,500 | $40,757 |
| 2018 | $402 | $54,257 | $13,500 | $40,757 |
| 2016 | $412 | $54,203 | $13,500 | $40,703 |
| 2015 | $398 | $54,203 | $13,500 | $40,703 |
| 2014 | $398 | $54,203 | $13,500 | $40,703 |
| 2013 | -- | $54,203 | $13,500 | $40,703 |
Source: Public Records
Map
Nearby Homes
- 608 Raleigh St
- 617 Raleigh St
- 211 Wilmington Ave
- 501 Raleigh St
- 106 Summitt Ave
- 412 Coggeshall St
- 421 Granville St
- 504 Henderson St
- 412 Kingsbury St
- 112 1st St
- 221 Gilliam St
- 206 1st St
- 405 Sycamore St
- 230 Maple Dr Unit 232
- 103 W Spring St
- 105 W Spring St
- 220 Maple Dr Unit A & B
- 102 Royall Rd
- 212 Orange St
- 505 Forest Rd