Estimated Value: $247,950 - $261,000
3
Beds
2
Baths
1,638
Sq Ft
$155/Sq Ft
Est. Value
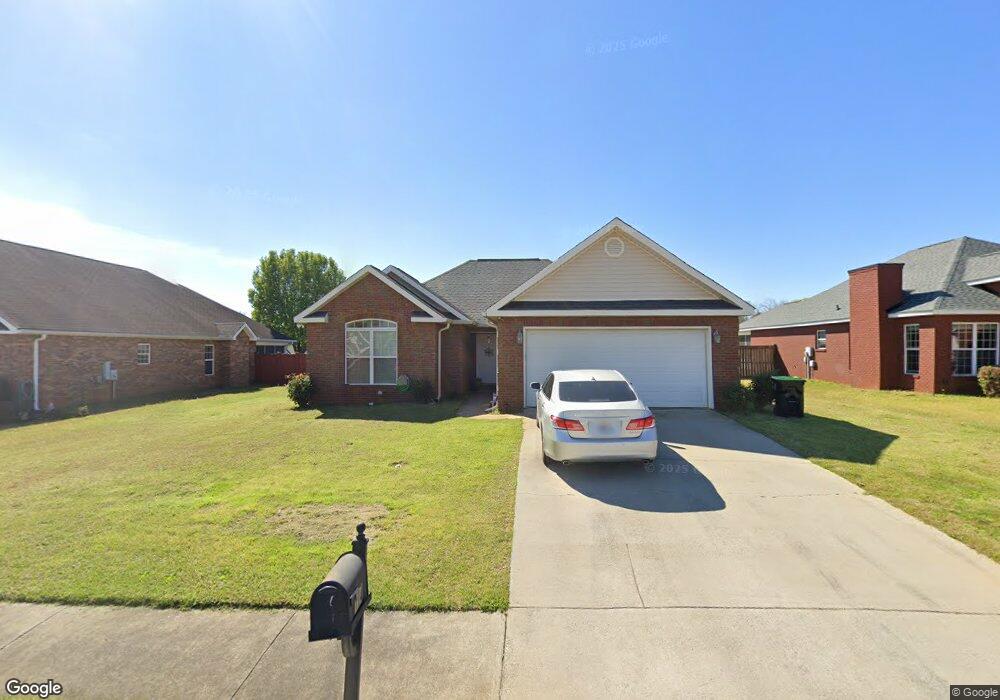
About This Home
This home is located at 114 Manchester Ln, Byron, GA 31008 and is currently estimated at $253,988, approximately $155 per square foot. 114 Manchester Ln is a home located in Peach County with nearby schools including Byron Elementary School, Byron Middle School, and Peach County High School.
Ownership History
Date
Name
Owned For
Owner Type
Purchase Details
Closed on
Jul 20, 2017
Sold by
Hill Shane D
Bought by
Lewis Cora
Current Estimated Value
Home Financials for this Owner
Home Financials are based on the most recent Mortgage that was taken out on this home.
Original Mortgage
$127,645
Outstanding Balance
$107,085
Interest Rate
4.25%
Mortgage Type
FHA
Estimated Equity
$146,903
Purchase Details
Closed on
Nov 1, 2005
Sold by
Boutwell Bobby E
Bought by
Hill Shane D
Home Financials for this Owner
Home Financials are based on the most recent Mortgage that was taken out on this home.
Original Mortgage
$139,707
Interest Rate
5.9%
Mortgage Type
FHA
Purchase Details
Closed on
Jan 25, 2005
Sold by
Southern Oaks Diversified Llc
Bought by
Boutwell Construction Inc
Purchase Details
Closed on
Sep 8, 2004
Sold by
Newton Development Llc
Bought by
Southern Oaks Diversified Llc
Create a Home Valuation Report for This Property
The Home Valuation Report is an in-depth analysis detailing your home's value as well as a comparison with similar homes in the area
Home Values in the Area
Average Home Value in this Area
Purchase History
| Date | Buyer | Sale Price | Title Company |
|---|---|---|---|
| Lewis Cora | $130,000 | -- | |
| Hill Shane D | $141,900 | -- | |
| Southern Oaks Diversified Llc | -- | -- | |
| Boutwell Construction Inc | $22,000 | -- | |
| Southern Oaks Diversified Llc | -- | -- |
Source: Public Records
Mortgage History
| Date | Status | Borrower | Loan Amount |
|---|---|---|---|
| Open | Lewis Cora | $127,645 | |
| Previous Owner | Southern Oaks Diversified Llc | $139,707 |
Source: Public Records
Tax History Compared to Growth
Tax History
| Year | Tax Paid | Tax Assessment Tax Assessment Total Assessment is a certain percentage of the fair market value that is determined by local assessors to be the total taxable value of land and additions on the property. | Land | Improvement |
|---|---|---|---|---|
| 2024 | $2,841 | $81,120 | $12,480 | $68,640 |
| 2023 | $2,781 | $78,920 | $10,000 | $68,920 |
| 2022 | $1,762 | $67,440 | $7,000 | $60,440 |
| 2021 | $1,731 | $57,440 | $7,000 | $50,440 |
| 2020 | $1,666 | $55,360 | $7,000 | $48,360 |
| 2019 | $1,674 | $55,360 | $7,000 | $48,360 |
| 2018 | $1,577 | $55,360 | $7,000 | $48,360 |
| 2017 | $1,592 | $50,240 | $7,000 | $43,240 |
| 2016 | $1,585 | $50,240 | $7,000 | $43,240 |
| 2015 | $1,588 | $50,240 | $7,000 | $43,240 |
| 2014 | $1,590 | $50,240 | $7,000 | $43,240 |
| 2013 | -- | $50,240 | $7,000 | $43,240 |
Source: Public Records
Map
Nearby Homes
- 112 Manchester Ln
- 116 Manchester Ln
- 111 Preston Ln
- 113 Preston Ln
- 113 Preston Ln Unit 7
- 110 Manchester Ln
- 110 Manchester Ln Unit 8
- 118 Manchester Ln
- 109 Preston Ln
- 115 Preston Ln
- 121 Manchester Ln
- 119 Manchester Ln
- 123 Manchester Ln
- 108 Manchester Ln
- 120 Manchester Ln
- 117 Manchester Ln
- 117 Preston Ln
- 125 Manchester Ln
- 107 Preston Ln
- 115 Manchester Ln