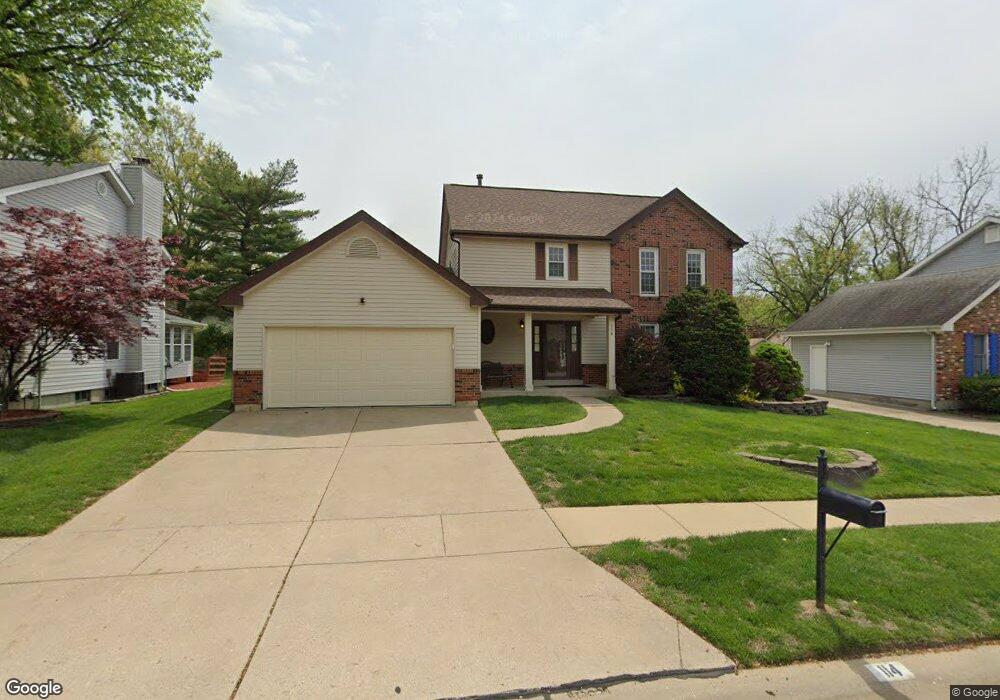
114 Mission Walk Ct Florissant, MO 63031
Estimated Value: $321,079 - $349,000
3
Beds
3
Baths
2,090
Sq Ft
$159/Sq Ft
Est. Value
About This Home
This home is located at 114 Mission Walk Ct, Florissant, MO 63031 and is currently estimated at $333,020, approximately $159 per square foot. 114 Mission Walk Ct is a home located in St. Louis County with nearby schools including Russell Elementary School, West Middle School, and Hazelwood West High School.
Ownership History
Date
Name
Owned For
Owner Type
Purchase Details
Closed on
Dec 17, 2019
Sold by
Cooksey Tonya S and Walker Maurice
Bought by
Cooksey Tonya S
Current Estimated Value
Purchase Details
Closed on
Sep 12, 2016
Sold by
Cooksey Tonya S and Walker Maurice
Bought by
Cooksey Tonya S and Walker Maurice
Purchase Details
Closed on
Nov 30, 2007
Sold by
Midkiff Roy F and Midkiff Patricia A
Bought by
Cooksey Tonya S
Home Financials for this Owner
Home Financials are based on the most recent Mortgage that was taken out on this home.
Original Mortgage
$187,064
Outstanding Balance
$118,479
Interest Rate
6.4%
Mortgage Type
FHA
Estimated Equity
$214,541
Purchase Details
Closed on
Oct 1, 1997
Sold by
Blacksher William A and Blacksher Barbara A
Bought by
Midkiff Roy F and Midkiff Patricia A
Home Financials for this Owner
Home Financials are based on the most recent Mortgage that was taken out on this home.
Original Mortgage
$123,750
Interest Rate
7.59%
Create a Home Valuation Report for This Property
The Home Valuation Report is an in-depth analysis detailing your home's value as well as a comparison with similar homes in the area
Home Values in the Area
Average Home Value in this Area
Purchase History
| Date | Buyer | Sale Price | Title Company |
|---|---|---|---|
| Cooksey Tonya S | -- | Lafayette Title Company | |
| Cooksey Tonya S | -- | Lafayette Title Company | |
| Cooksey Tonya S | $190,000 | None Available | |
| Midkiff Roy F | -- | -- |
Source: Public Records
Mortgage History
| Date | Status | Borrower | Loan Amount |
|---|---|---|---|
| Open | Cooksey Tonya S | $187,064 | |
| Previous Owner | Midkiff Roy F | $123,750 |
Source: Public Records
Tax History Compared to Growth
Tax History
| Year | Tax Paid | Tax Assessment Tax Assessment Total Assessment is a certain percentage of the fair market value that is determined by local assessors to be the total taxable value of land and additions on the property. | Land | Improvement |
|---|---|---|---|---|
| 2025 | $4,023 | $54,760 | $7,830 | $46,930 |
| 2024 | $4,023 | $49,880 | $5,230 | $44,650 |
| 2023 | $4,073 | $49,880 | $5,230 | $44,650 |
| 2022 | $3,498 | $38,270 | $6,100 | $32,170 |
| 2021 | $3,439 | $38,270 | $6,100 | $32,170 |
| 2020 | $3,590 | $37,410 | $6,950 | $30,460 |
| 2019 | $3,539 | $37,410 | $6,950 | $30,460 |
| 2018 | $3,296 | $32,290 | $5,230 | $27,060 |
| 2017 | $3,282 | $32,290 | $5,230 | $27,060 |
| 2016 | $3,211 | $31,290 | $4,540 | $26,750 |
| 2015 | $3,084 | $31,290 | $4,540 | $26,750 |
| 2014 | $2,918 | $29,480 | $5,050 | $24,430 |
Source: Public Records
Map
Nearby Homes
- 248 Chianti Ct
- 2252 Riverwood Trails Dr Unit 2252
- 5 Seminary Ct
- 2 Taylor Trail Place
- 1030 Gifford Ct
- 12 Miraclair Dr
- 154 Riverwood Park Dr
- 1090 Howdershell Rd
- 1035 Rosary Tree Ct
- 2324 Fernau Ct
- 2320 Fernau Ct
- 2316 Fernau Ct
- 2 Berwick at Koch Park Manors
- 2321 Fernau Ct
- 2317 Fernau Ct
- 2 Aspen at Koch Park Manors
- 2 Sterling at Koch Park Manors
- 2 Ashford at Koch Park Manors
- 2 Maple at Koch Park Manors
- 275 Noser Dr
- 120 Mission Walk Ct
- 108 Mission Walk Ct
- 111 Saint Stanislaus Ct
- 119 Saint Stanislaus Ct
- 107 Saint Stanislaus Ct
- 126 Mission Walk Ct
- 109 Mission Walk Ct
- 115 Mission Walk Ct
- 102 Mission Walk Ct
- 125 Saint Stanislaus Ct
- 125 Mission Walk Ct
- 40 Riverwood Estates Blvd
- 52 Riverwood Estates Blvd
- 132 Mission Walk Ct
- 45 Estates at Behlmann Farms Lot
- 112 Saint Stanislaus Ct
- 131 Mission Walk Ct
- 129 Saint Stanislaus Ct
- 118 Saint Stanislaus Ct
- 106 Saint Stanislaus Ct