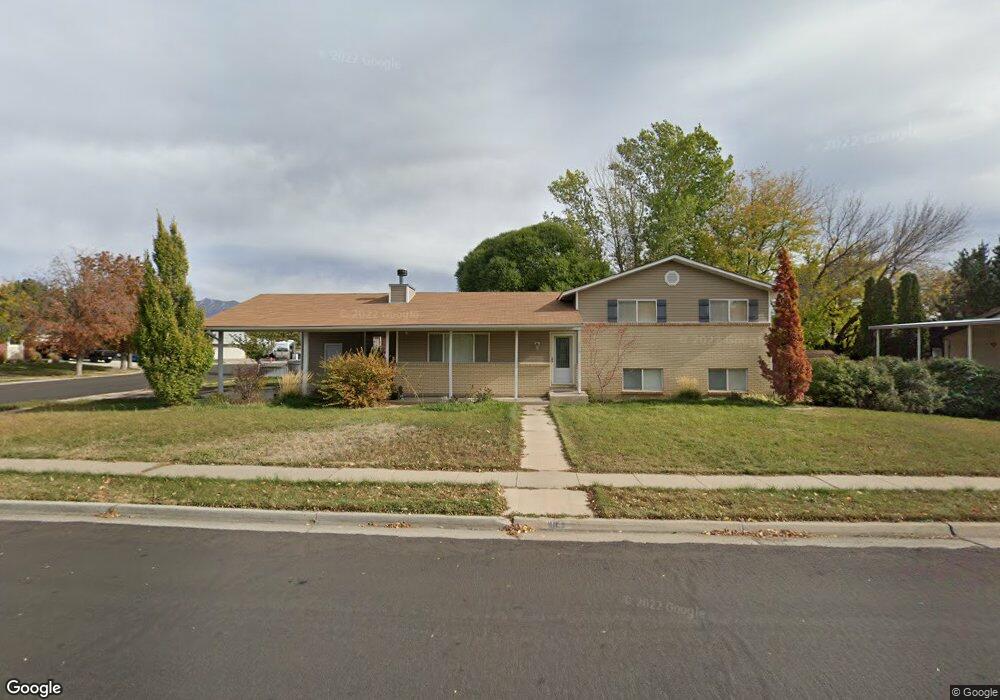
114 N 1200 W Clearfield, UT 84015
Estimated Value: $440,689 - $457,000
4
Beds
2
Baths
1,934
Sq Ft
$232/Sq Ft
Est. Value
About This Home
This home is located at 114 N 1200 W, Clearfield, UT 84015 and is currently estimated at $449,422, approximately $232 per square foot. 114 N 1200 W is a home located in Davis County with nearby schools including Holt Elementary School, North Davis Junior High School, and Syracuse High School.
Ownership History
Date
Name
Owned For
Owner Type
Purchase Details
Closed on
Jun 15, 2017
Sold by
Allen Hyrum D and Allen Laura T
Bought by
Ames Aaron S
Current Estimated Value
Home Financials for this Owner
Home Financials are based on the most recent Mortgage that was taken out on this home.
Original Mortgage
$12,960
Outstanding Balance
$10,754
Interest Rate
4.02%
Mortgage Type
New Conventional
Estimated Equity
$438,668
Purchase Details
Closed on
Jul 25, 2013
Sold by
Monroe Dennis Lavon and Monroe Trudy M
Bought by
Allen Hyrum D and Allen Laura T
Home Financials for this Owner
Home Financials are based on the most recent Mortgage that was taken out on this home.
Original Mortgage
$145,350
Interest Rate
3.98%
Mortgage Type
New Conventional
Create a Home Valuation Report for This Property
The Home Valuation Report is an in-depth analysis detailing your home's value as well as a comparison with similar homes in the area
Home Values in the Area
Average Home Value in this Area
Purchase History
| Date | Buyer | Sale Price | Title Company |
|---|---|---|---|
| Ames Aaron S | -- | -- | |
| Allen Hyrum D | -- | Mountain View Title |
Source: Public Records
Mortgage History
| Date | Status | Borrower | Loan Amount |
|---|---|---|---|
| Open | Ames Aaron S | $12,960 | |
| Previous Owner | Allen Hyrum D | $145,350 |
Source: Public Records
Tax History Compared to Growth
Tax History
| Year | Tax Paid | Tax Assessment Tax Assessment Total Assessment is a certain percentage of the fair market value that is determined by local assessors to be the total taxable value of land and additions on the property. | Land | Improvement |
|---|---|---|---|---|
| 2025 | $2,418 | $216,700 | $71,996 | $144,704 |
| 2024 | $2,340 | $211,200 | $72,427 | $138,773 |
| 2023 | $2,155 | $357,000 | $115,552 | $241,448 |
| 2022 | $2,259 | $202,400 | $62,549 | $139,851 |
| 2021 | $1,987 | $269,000 | $68,192 | $200,808 |
| 2020 | $1,725 | $232,000 | $57,667 | $174,333 |
| 2019 | $1,680 | $223,000 | $59,270 | $163,730 |
| 2018 | $1,500 | $194,000 | $52,608 | $141,392 |
| 2016 | $1,297 | $87,670 | $21,127 | $66,543 |
| 2015 | $1,196 | $77,110 | $21,127 | $55,983 |
| 2014 | $1,178 | $76,977 | $21,127 | $55,850 |
| 2013 | -- | $83,597 | $30,096 | $53,501 |
Source: Public Records
Map
Nearby Homes
- 16 N 1300 W
- 303 N Canterbury Way
- 417 N 1200 W Unit 84
- 423 N 1250 W Unit 118
- Evergreen Plan at Ivie Meadows
- 274 N 825 W
- 288 N 825 W
- 135 S 1525 W
- 4284 W 350 S Unit 615
- 4296 W 350 S Unit 614
- 575 N 1350 W Unit 137
- 1337 W 550 N Unit 195
- 777 W 300 N
- 563 N 1350 W Unit 139
- 1350 W 300 N Unit 49
- 1350 W 300 N Unit 38
- 1350 W 300 N Unit 29
- 762 W 300 N
- 1648 W 150 S
- 232 N Rick Way