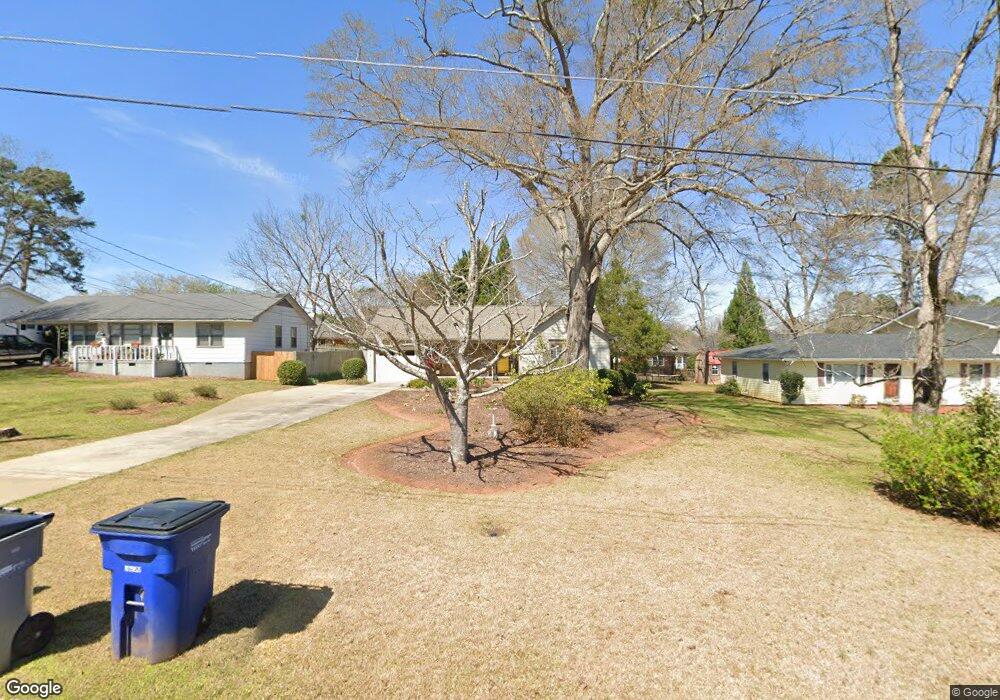
114 N Chilton Crescent Lagrange, GA 30240
Estimated Value: $214,088 - $293,000
3
Beds
2
Baths
1,575
Sq Ft
$156/Sq Ft
Est. Value
About This Home
This home is located at 114 N Chilton Crescent, Lagrange, GA 30240 and is currently estimated at $245,522, approximately $155 per square foot. 114 N Chilton Crescent is a home located in Troup County with nearby schools including Franklin Forest Elementary School, Hollis Hand Elementary School, and Ethel W. Kight Elementary School.
Ownership History
Date
Name
Owned For
Owner Type
Purchase Details
Closed on
Oct 25, 2017
Sold by
Edmonds Betty A
Bought by
Sosebee Michael Lane and Sosebee Cox Jennifer
Current Estimated Value
Purchase Details
Closed on
Feb 17, 2004
Sold by
Sherry F Lummus
Bought by
Edmonds Betty A
Purchase Details
Closed on
Aug 12, 2002
Sold by
Josephine Paul and Josephine Hudson
Bought by
Sherry F Lummus
Purchase Details
Closed on
Feb 28, 1995
Sold by
Brazell Donna
Bought by
Josephine Paul and Josephine Hudson
Purchase Details
Closed on
Jul 26, 1985
Sold by
Lee Mary Ann Land Only
Bought by
Brazell Donna
Purchase Details
Closed on
Jul 1, 1982
Sold by
Veal Agnes Moore
Bought by
Lee Mary Ann Land Only
Purchase Details
Closed on
Aug 2, 1977
Sold by
Veal Emmett Ford
Bought by
Veal Agnes Moore
Purchase Details
Closed on
Jan 1, 1971
Sold by
Veal Agnes
Bought by
Veal Emmett Ford
Purchase Details
Closed on
Aug 1, 1966
Sold by
Lee Charles E
Bought by
Veal Agnes
Create a Home Valuation Report for This Property
The Home Valuation Report is an in-depth analysis detailing your home's value as well as a comparison with similar homes in the area
Home Values in the Area
Average Home Value in this Area
Purchase History
| Date | Buyer | Sale Price | Title Company |
|---|---|---|---|
| Sosebee Michael Lane | $132,000 | -- | |
| Edmonds Betty A | $124,500 | -- | |
| Sherry F Lummus | $90,700 | -- | |
| Josephine Paul | $68,500 | -- | |
| Brazell Donna | $6,000 | -- | |
| Lee Mary Ann Land Only | -- | -- | |
| Veal Agnes Moore | -- | -- | |
| Veal Emmett Ford | -- | -- | |
| Veal Agnes | -- | -- |
Source: Public Records
Tax History Compared to Growth
Tax History
| Year | Tax Paid | Tax Assessment Tax Assessment Total Assessment is a certain percentage of the fair market value that is determined by local assessors to be the total taxable value of land and additions on the property. | Land | Improvement |
|---|---|---|---|---|
| 2024 | $2,018 | $73,976 | $6,600 | $67,376 |
| 2023 | $1,597 | $58,540 | $6,600 | $51,940 |
| 2022 | $1,539 | $55,140 | $6,600 | $48,540 |
| 2021 | $1,631 | $54,072 | $6,600 | $47,472 |
| 2020 | $1,631 | $54,072 | $6,600 | $47,472 |
| 2019 | $1,518 | $50,320 | $6,600 | $43,720 |
| 2018 | $1,518 | $50,320 | $6,600 | $43,720 |
| 2017 | $752 | $34,900 | $6,300 | $28,600 |
| 2016 | $759 | $35,126 | $6,300 | $28,826 |
| 2015 | $769 | $35,429 | $6,602 | $28,826 |
| 2014 | $723 | $33,912 | $6,602 | $27,309 |
| 2013 | -- | $34,804 | $6,616 | $28,188 |
Source: Public Records
Map
Nearby Homes
- 106 S Chilton Crescent
- 201 S Chilton Crescent
- 203 S Chilton Crescent
- 100 Creekside Dr Unit LOT 60A
- 107 Dixie Creek Dr
- 724 Camellia Dr
- 106 Ewing St
- 102 Ewing St
- 145 Turner St
- 748 Lakewood Dr
- 204 Colonial St
- 110 Russell St
- 806 New Franklin Rd
- 114 Briarcliff Rd
- 900 North St
- 127 Ashling Dr
- 134 S Page St
- 109 Thomas St
- 219 Banks St
- 400 S Page St
- 118 N Chilton Crescent
- 0 N Chilton Crescent
- 112 N Chilton Crescent
- 120 N Chilton Crescent
- 160 Wisteria Ridge Terrace
- 158 Wisteria Ridge Terrace
- 162 Wisteria Ridge Terrace
- 110 N Chilton Crescent
- 110 N Chilton Crescent Unit 4
- 164 Wisteria Ridge Terrace
- 113 N Chilton Crescent
- 154 Wisteria Ridge Terrace
- 122 N Chilton Crescent
- 119 N Chilton Crescent
- 166 Wisteria Ridge Terrace
- 111 N Chilton Crescent
- 152 Wisteria Ridge Terrace
- 108 N Chilton Crescent
- 121 N Chilton Crescent
- 109 N Chilton Crescent