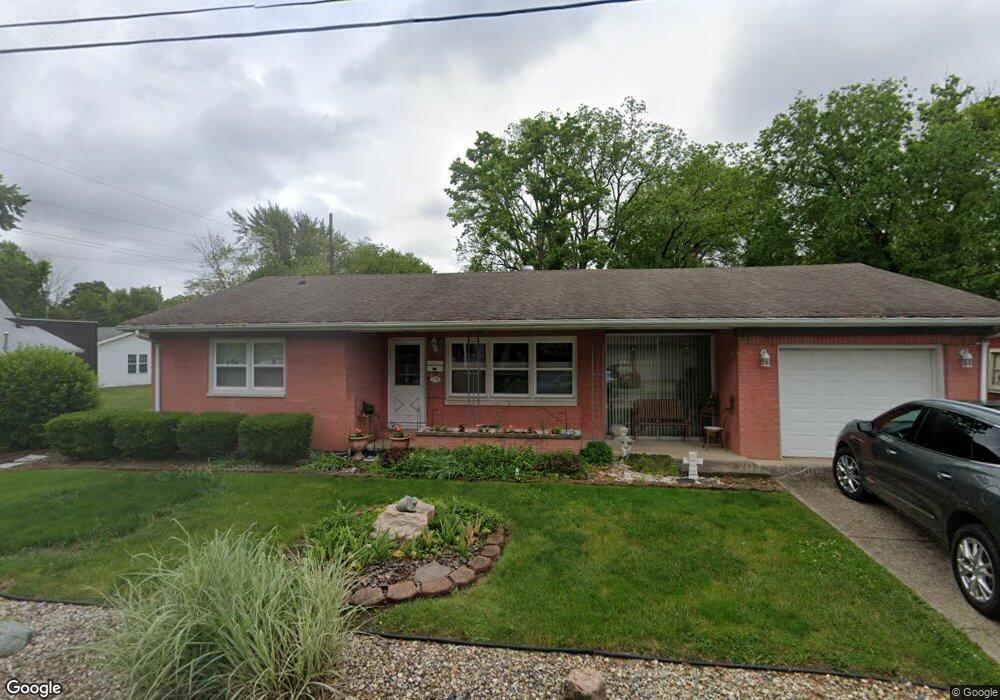
114 N East St Pendleton, IN 46064
Estimated Value: $216,963 - $254,000
2
Beds
1
Bath
1,254
Sq Ft
$189/Sq Ft
Est. Value
About This Home
This home is located at 114 N East St, Pendleton, IN 46064 and is currently estimated at $236,741, approximately $188 per square foot. 114 N East St is a home located in Madison County with nearby schools including Pendleton Elementary School and Pendleton Heights Middle School.
Ownership History
Date
Name
Owned For
Owner Type
Purchase Details
Closed on
Jun 30, 2005
Sold by
Chambless Alice Elaine
Bought by
Chambless Alice Elaine and Pring Deanna L
Current Estimated Value
Home Financials for this Owner
Home Financials are based on the most recent Mortgage that was taken out on this home.
Original Mortgage
$74,000
Interest Rate
5.87%
Mortgage Type
New Conventional
Purchase Details
Closed on
Jun 14, 2005
Sold by
Jarvis Phyllis and Whitinger Judith D
Bought by
Chambless Alice Elaine
Home Financials for this Owner
Home Financials are based on the most recent Mortgage that was taken out on this home.
Original Mortgage
$74,000
Interest Rate
5.87%
Mortgage Type
New Conventional
Create a Home Valuation Report for This Property
The Home Valuation Report is an in-depth analysis detailing your home's value as well as a comparison with similar homes in the area
Home Values in the Area
Average Home Value in this Area
Purchase History
| Date | Buyer | Sale Price | Title Company |
|---|---|---|---|
| Chambless Alice Elaine | -- | -- | |
| Chambless Alice Elaine | -- | -- |
Source: Public Records
Mortgage History
| Date | Status | Borrower | Loan Amount |
|---|---|---|---|
| Closed | Chambless Alice Elaine | $74,000 |
Source: Public Records
Tax History
| Year | Tax Paid | Tax Assessment Tax Assessment Total Assessment is a certain percentage of the fair market value that is determined by local assessors to be the total taxable value of land and additions on the property. | Land | Improvement |
|---|---|---|---|---|
| 2025 | $1,111 | $138,300 | $26,400 | $111,900 |
| 2024 | $1,111 | $126,700 | $26,400 | $100,300 |
| 2023 | $1,072 | $116,600 | $25,200 | $91,400 |
| 2022 | $1,076 | $115,300 | $23,700 | $91,600 |
| 2021 | $1,021 | $110,900 | $23,700 | $87,200 |
| 2020 | $1,130 | $105,400 | $22,600 | $82,800 |
| 2019 | $1,032 | $105,500 | $22,600 | $82,900 |
| 2018 | $928 | $97,300 | $22,600 | $74,700 |
| 2017 | $815 | $89,000 | $20,900 | $68,100 |
| 2016 | $814 | $89,000 | $20,900 | $68,100 |
| 2014 | $801 | $87,800 | $20,900 | $66,900 |
| 2013 | $801 | $87,800 | $20,900 | $66,900 |
Source: Public Records
Map
Nearby Homes
- 400 E Water St
- 201 N East St
- 1000 East St
- 110 W Water St
- 460 E Madison Ave
- 315 W High St
- 621 S Silver St
- 720 S Broadway St
- 513 W State St
- 227 Jefferson St
- 6972 S 300 W
- 238 Jefferson St
- 3006 Huntsville Rd
- 928 S Broadway St
- 9806 Olympic Blvd
- 8093 Ridge Line Dr
- 637 Kilmore Dr
- 8094 Ridge Line Dr
- 305 Waterford Ln
- 7160 Murph Way
Your Personal Tour Guide
Ask me questions while you tour the home.