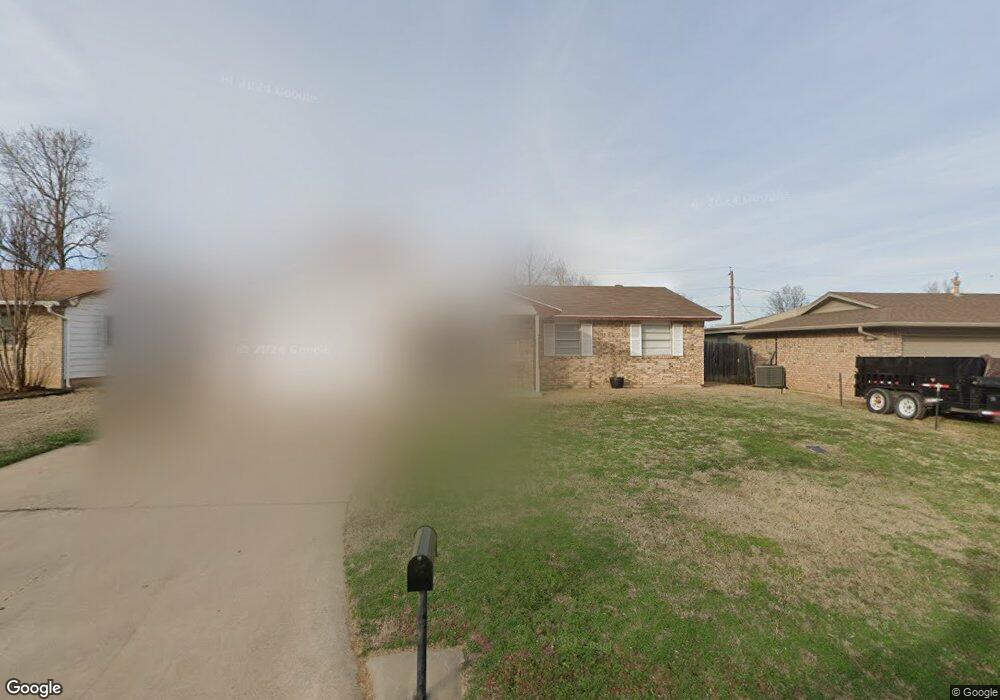
114 NE Dunlop St Lawton, OK 73507
Estimated Value: $124,000 - $137,000
3
Beds
2
Baths
1,200
Sq Ft
$107/Sq Ft
Est. Value
About This Home
This home is located at 114 NE Dunlop St, Lawton, OK 73507 and is currently estimated at $128,863, approximately $107 per square foot. 114 NE Dunlop St is a home located in Comanche County with nearby schools including Pioneer Park Elementary School, MacArthur Middle School, and MacArthur High School.
Ownership History
Date
Name
Owned For
Owner Type
Purchase Details
Closed on
Sep 9, 2019
Sold by
Johnson Sharonica M
Bought by
Cowden Weston C
Current Estimated Value
Home Financials for this Owner
Home Financials are based on the most recent Mortgage that was taken out on this home.
Original Mortgage
$34,840
Outstanding Balance
$30,513
Interest Rate
3.7%
Mortgage Type
Future Advance Clause Open End Mortgage
Estimated Equity
$98,350
Purchase Details
Closed on
Sep 6, 2019
Sold by
Cowden Weston C
Bought by
Cow Dens Llc
Home Financials for this Owner
Home Financials are based on the most recent Mortgage that was taken out on this home.
Original Mortgage
$34,840
Outstanding Balance
$30,513
Interest Rate
3.7%
Mortgage Type
Future Advance Clause Open End Mortgage
Estimated Equity
$98,350
Purchase Details
Closed on
Jan 23, 2002
Sold by
Fleming Willie J P
Bought by
Johnson Sharonica M
Purchase Details
Closed on
Jun 7, 2001
Sold by
Wilson Annie L
Create a Home Valuation Report for This Property
The Home Valuation Report is an in-depth analysis detailing your home's value as well as a comparison with similar homes in the area
Home Values in the Area
Average Home Value in this Area
Purchase History
| Date | Buyer | Sale Price | Title Company |
|---|---|---|---|
| Cowden Weston C | $37,978 | Title & Closing Llc | |
| Cow Dens Llc | -- | Title & Closing Llc | |
| Johnson Sharonica M | $52,000 | -- | |
| -- | -- | -- |
Source: Public Records
Mortgage History
| Date | Status | Borrower | Loan Amount |
|---|---|---|---|
| Open | Cow Dens Llc | $34,840 |
Source: Public Records
Tax History Compared to Growth
Tax History
| Year | Tax Paid | Tax Assessment Tax Assessment Total Assessment is a certain percentage of the fair market value that is determined by local assessors to be the total taxable value of land and additions on the property. | Land | Improvement |
|---|---|---|---|---|
| 2025 | $1,459 | $14,161 | $2,813 | $11,348 |
| 2024 | $1,459 | $13,487 | $2,813 | $10,674 |
| 2023 | $1,459 | $9,522 | $2,250 | $7,272 |
| 2022 | $967 | $9,069 | $2,250 | $6,819 |
| 2021 | $943 | $9,218 | $2,250 | $6,968 |
| 2020 | $904 | $8,889 | $2,250 | $6,639 |
| 2019 | $799 | $8,915 | $2,250 | $6,665 |
| 2018 | $919 | $10,234 | $1,927 | $8,307 |
| 2017 | $765 | $9,936 | $1,629 | $8,307 |
| 2016 | $760 | $9,647 | $1,069 | $8,578 |
| 2015 | $748 | $9,366 | $1,069 | $8,297 |
| 2014 | $717 | $9,094 | $1,069 | $8,025 |
Source: Public Records
Map
Nearby Homes
- 111 NE English St
- 109 NE English St
- 125 NE Cimarron Trail
- 803 NE Turtle Dove Ln
- 908 NE Dove Ln
- 2905 NE Tortoise Dr
- 204 NW Mockingbird Rd
- 2604 NE Garden Ln
- 1004 NE Bob White Rd
- 0 NE Rogers Ln
- 418 NW Glendale Dr
- 513 NW Mission Blvd
- 605 NW Glendale Dr
- 832 NW Hilltop Dr
- 1216 NW Carroll Dr
- 1205 NW Bessie Ave
- 1183 NW Ozmun Ave
- 1411 NW Ozmun Ave
- 1219 NW Williams Ave
- 1110 NW Irwin Ave
- 116 NE Dunlop St
- 112 NE Dunlop St
- 118 NE Dunlop St
- 117 NE English St
- 113 NE Dunlop St
- 110 NE Dunlop St
- 111 NE Dunlop St
- 115 NE Dunlop St
- 109 NE Dunlop St
- 115 NE English St
- 113 NE English St
- 119 NE English St
- 120 NE Dunlop St
- 108 NE Dunlop St
- 117 NE Dunlop St
- 121 NE English St
- 107 NE Dunlop St
- 106 NE Dunlop St
- 123 NE English St
- 122 NE Dunlop St