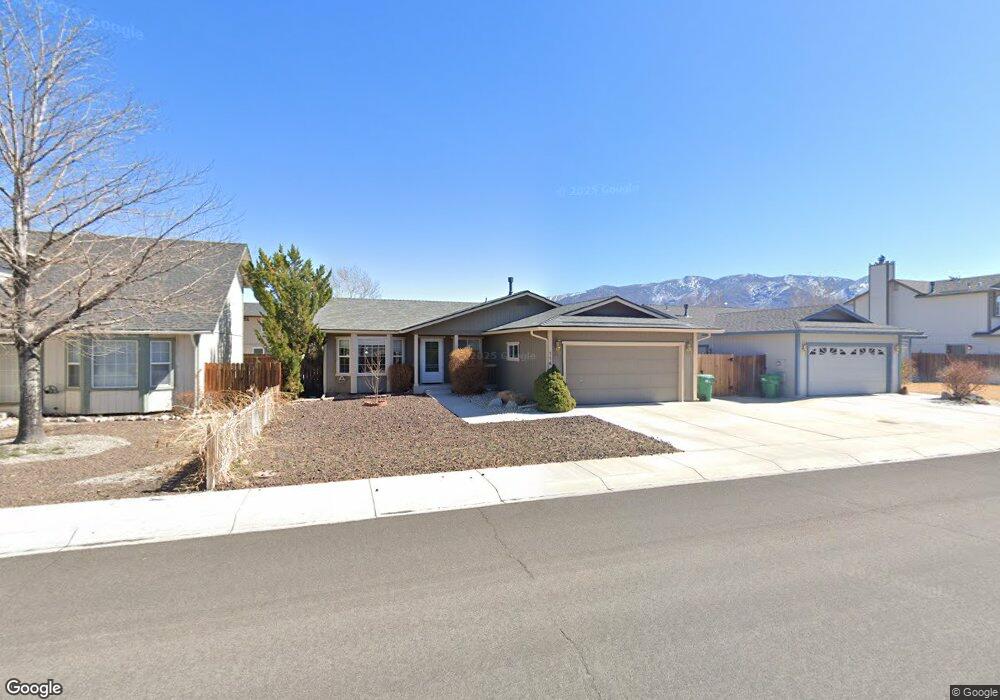
114 Northpointe Cir Dayton, NV 89403
Estimated Value: $387,000 - $401,000
3
Beds
2
Baths
1,444
Sq Ft
$272/Sq Ft
Est. Value
About This Home
This home is located at 114 Northpointe Cir, Dayton, NV 89403 and is currently estimated at $393,190, approximately $272 per square foot. 114 Northpointe Cir is a home located in Lyon County with nearby schools including Dayton Elementary School, Dayton Intermediate School, and Dayton High School.
Ownership History
Date
Name
Owned For
Owner Type
Purchase Details
Closed on
Sep 9, 2022
Sold by
Rhow Elizabeth D
Bought by
Porteur/Rhow Family Trust
Current Estimated Value
Purchase Details
Closed on
Jan 7, 2019
Sold by
Rhow Elizabeth D and Rhow Elizabeth
Bought by
Rhow Elizabeth D and Elizabeth D Rhow Separate Prop
Purchase Details
Closed on
May 21, 2013
Sold by
Federal Home Loan Mortgage Corporation
Bought by
Wegner Lawrence E and Wegner Joyce C
Home Financials for this Owner
Home Financials are based on the most recent Mortgage that was taken out on this home.
Original Mortgage
$122,448
Interest Rate
3.57%
Mortgage Type
New Conventional
Purchase Details
Closed on
Feb 20, 2013
Sold by
Jacobsen Theodore G
Bought by
Federal Home Loan Mortgage Corporation
Create a Home Valuation Report for This Property
The Home Valuation Report is an in-depth analysis detailing your home's value as well as a comparison with similar homes in the area
Home Values in the Area
Average Home Value in this Area
Purchase History
| Date | Buyer | Sale Price | Title Company |
|---|---|---|---|
| Porteur/Rhow Family Trust | -- | -- | |
| Rhow Elizabeth D | -- | -- | |
| Rhow Elizabeth D | -- | None Available | |
| Wegner Lawrence E | $120,000 | First American Title Ndts Re | |
| Federal Home Loan Mortgage Corporation | $109,000 | Lawyers Title Default Servic |
Source: Public Records
Mortgage History
| Date | Status | Borrower | Loan Amount |
|---|---|---|---|
| Previous Owner | Wegner Lawrence E | $122,448 |
Source: Public Records
Tax History Compared to Growth
Tax History
| Year | Tax Paid | Tax Assessment Tax Assessment Total Assessment is a certain percentage of the fair market value that is determined by local assessors to be the total taxable value of land and additions on the property. | Land | Improvement |
|---|---|---|---|---|
| 2025 | $1,762 | $108,088 | $59,500 | $48,588 |
| 2024 | $1,711 | $108,659 | $59,500 | $49,158 |
| 2023 | $1,711 | $105,835 | $59,500 | $46,335 |
| 2022 | $1,376 | $102,377 | $59,500 | $42,877 |
| 2021 | $1,336 | $96,237 | $54,250 | $41,987 |
| 2020 | $1,297 | $85,876 | $45,500 | $40,376 |
| 2019 | $1,259 | $77,657 | $38,500 | $39,157 |
| 2018 | $1,222 | $62,841 | $24,500 | $38,341 |
| 2017 | $1,173 | $51,070 | $12,600 | $38,470 |
| 2016 | $1,143 | $45,832 | $6,300 | $39,532 |
| 2015 | $1,141 | $35,733 | $6,300 | $29,433 |
| 2014 | $1,108 | $35,132 | $6,300 | $28,832 |
Source: Public Records
Map
Nearby Homes
- 131 N Pointe Cir
- 509 Vail Dr Unit 3
- 301 Valley View Dr
- 401 Valley View Ct
- 111 Augusta Ct
- 435 La Costa Cir
- 135 Catlin St
- 109 Finney St
- 02968239 Dayton Valley Rd
- 120 Cosser St
- 363 Bayhill Cir
- 252 La Costa Ave
- 405 Cypress Ct
- 302 Royal Troon Dr
- 357 Bayhill Cir
- 170 Reese Way
- 236 La Costa Ave
- 349 Bayhill Cir Unit 2
- 262 Cruden Bay Dr
- 383 Royal Troon Dr
- 114 N Pointe Cir
- 116 Northpointe Cir
- 112 Northpointe Cir
- 116 N Pointe Cir
- 213 Alpine Dr
- 209 Alpine Dr
- 118 Northpointe Cir
- 110 Northpointe Cir
- 110 N Pointe Cir
- 118 N Pointe Cir
- 115 N Pointe Cir
- 215 Alpine Dr
- 115 Northpointe Cir
- 111 Northpointe Cir
- 207 Alpine Dr
- 108 N Pointe Cir
- 120 Northpointe Cir
- 108 Northpointe Cir
- 119 N Pointe Cir
- 217 Alpine Dr