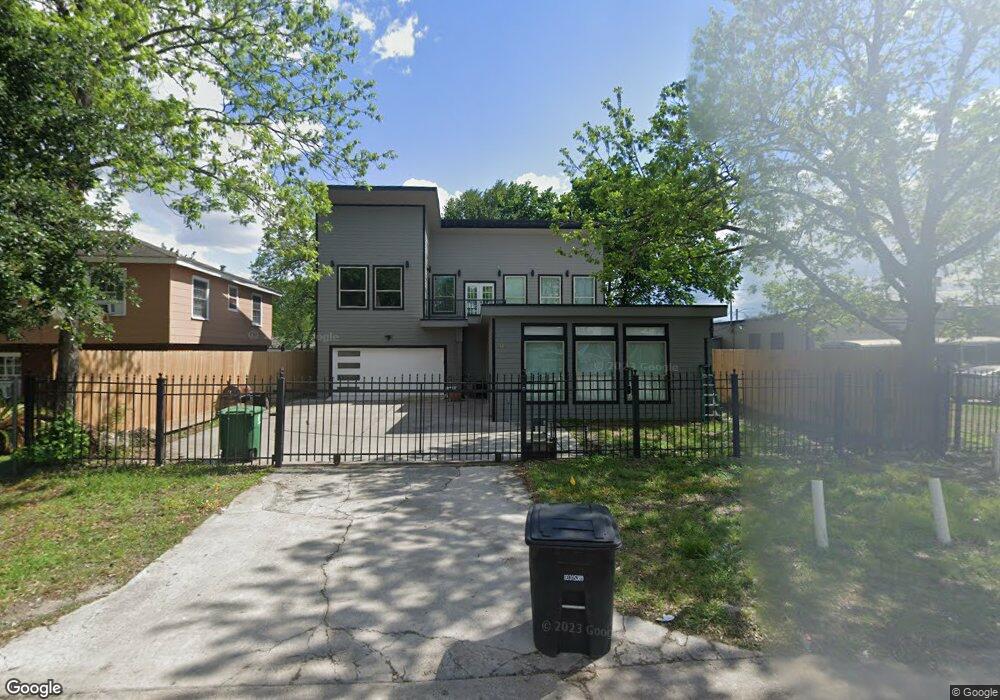
114 Norview Dr Houston, TX 77022
Independence Heights NeighborhoodEstimated Value: $405,191 - $462,000
3
Beds
2
Baths
1,064
Sq Ft
$407/Sq Ft
Est. Value
About This Home
This home is located at 114 Norview Dr, Houston, TX 77022 and is currently estimated at $433,548, approximately $407 per square foot. 114 Norview Dr is a home located in Harris County with nearby schools including Kennedy Elementary School, Williams Middle, and Booker T Washington Sr High.
Ownership History
Date
Name
Owned For
Owner Type
Purchase Details
Closed on
Feb 6, 2020
Sold by
Patino Jessica
Bought by
Manteca Natalie
Current Estimated Value
Home Financials for this Owner
Home Financials are based on the most recent Mortgage that was taken out on this home.
Original Mortgage
$114,000
Outstanding Balance
$101,168
Interest Rate
3.72%
Mortgage Type
New Conventional
Estimated Equity
$332,380
Purchase Details
Closed on
Jan 29, 2013
Sold by
Ortega Esteban
Bought by
Patino Martha Elena
Purchase Details
Closed on
Mar 20, 2009
Sold by
Cassey Brenda
Bought by
Patino Jessica
Home Financials for this Owner
Home Financials are based on the most recent Mortgage that was taken out on this home.
Original Mortgage
$44,184
Interest Rate
5.21%
Mortgage Type
FHA
Purchase Details
Closed on
Apr 14, 2008
Sold by
Nationstar Mortgage Llc
Bought by
Cassey Brenda
Purchase Details
Closed on
Dec 10, 2007
Sold by
Mingo Nicole and Jacquot Michael
Bought by
Nationstar Mortgage Llc
Create a Home Valuation Report for This Property
The Home Valuation Report is an in-depth analysis detailing your home's value as well as a comparison with similar homes in the area
Home Values in the Area
Average Home Value in this Area
Purchase History
| Date | Buyer | Sale Price | Title Company |
|---|---|---|---|
| Manteca Natalie | -- | Fidelity National Title | |
| Patino Martha Elena | -- | None Available | |
| Patino Jessica | -- | First American Title | |
| Cassey Brenda | -- | Chicago Title Insurance Comp | |
| Nationstar Mortgage Llc | $55,250 | None Available |
Source: Public Records
Mortgage History
| Date | Status | Borrower | Loan Amount |
|---|---|---|---|
| Open | Manteca Natalie | $114,000 | |
| Previous Owner | Patino Jessica | $44,184 |
Source: Public Records
Tax History
| Year | Tax Paid | Tax Assessment Tax Assessment Total Assessment is a certain percentage of the fair market value that is determined by local assessors to be the total taxable value of land and additions on the property. | Land | Improvement |
|---|---|---|---|---|
| 2025 | $5,350 | $401,623 | $116,640 | $284,983 |
| 2024 | $5,350 | $370,841 | $116,640 | $254,201 |
| 2023 | $5,350 | $400,000 | $93,312 | $306,688 |
| 2022 | $8,413 | $382,069 | $93,312 | $288,757 |
| 2021 | $5,092 | $218,474 | $93,312 | $125,162 |
| 2020 | $2,389 | $98,635 | $46,656 | $51,979 |
| 2019 | $1,998 | $96,408 | $46,656 | $49,752 |
| 2018 | $1,159 | $73,684 | $27,216 | $46,468 |
| 2017 | $1,650 | $73,684 | $27,216 | $46,468 |
| 2016 | $1,500 | $70,093 | $19,440 | $50,653 |
| 2015 | $834 | $57,973 | $19,440 | $38,533 |
| 2014 | $834 | $50,255 | $19,440 | $30,815 |
Source: Public Records
Map
Nearby Homes
- 115 E Thornton Rd
- 121 Norview Dr
- 108 Knightsbridge Park Ln
- 4711 Thornton Villas Ln
- 126 Knightsbridge Park Ln
- 4709 Thornton Villas Ln
- 4710 Thornton Villas Ln
- 4510 Old Yale St Unit A
- 148 W Whitney St
- 144 Knightsbridge Park Ln
- 218 Victoria Dr
- 4510 Trevor Park Ln
- 241 Norview Dr
- 4815 Martin Oaks Ln
- 4602 Crown Grove Ln
- 4748 Martin Hill St
- 4750 Martin Hill St
- 4744 Martin Hill St
- 4754 Martin Hill St
- 4752 Martin Hill St
- 113 Norview Dr
- 125 Norview Dr
- 302 Cyclamen St
- 117 Norview Dr
- 107 E Thornton Rd
- 111 E Thornton Rd
- 103 E Thornton Rd
- 304 Cyclamen St
- 303 Sowbread St
- 119 Norview Dr
- 135 Norview Dr
- 123 Norview Dr
- 306 Cyclamen St
- 4611 Yale St
- 307 Cyclamen St
- 305 Sowbread St
- 306 Sowbread St
- 308 Cyclamen St
- 141 Norview Dr
- 309 Cyclamen St
Your Personal Tour Guide
Ask me questions while you tour the home.