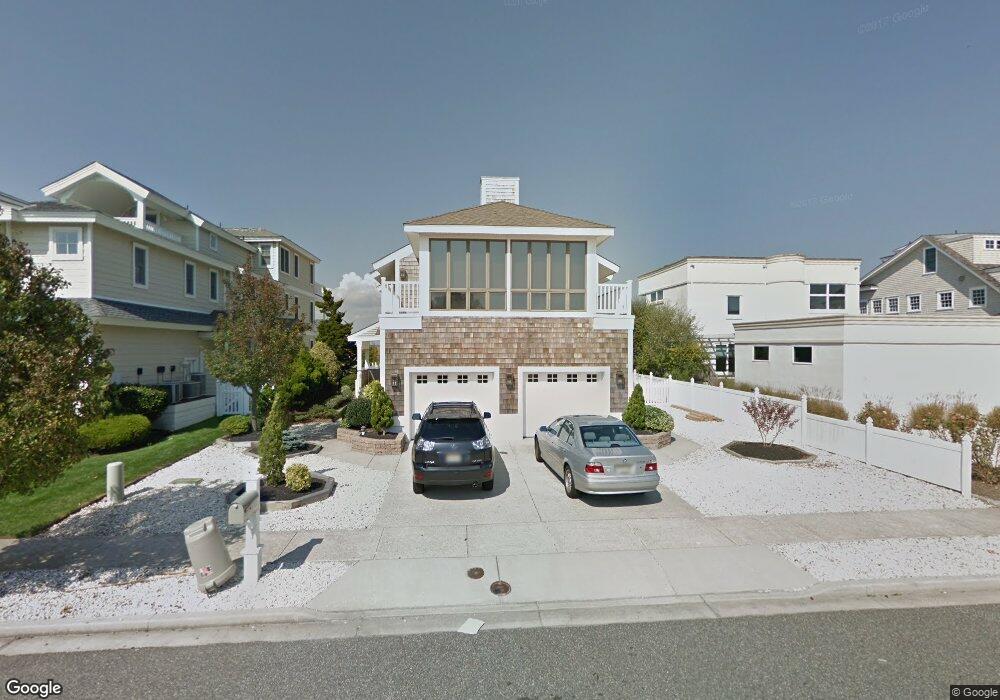
114 Pelican Dr S Avalon, NJ 08202
Estimated Value: $4,590,000 - $5,510,000
--
Bed
--
Bath
3,588
Sq Ft
$1,388/Sq Ft
Est. Value
About This Home
This home is located at 114 Pelican Dr S, Avalon, NJ 08202 and is currently estimated at $4,980,247, approximately $1,388 per square foot. 114 Pelican Dr S is a home located in Cape May County with nearby schools including Avalon Elementary School.
Ownership History
Date
Name
Owned For
Owner Type
Purchase Details
Closed on
Nov 19, 2014
Sold by
The Regina M Polsenberg 2004 Qprt
Bought by
Thomas Ann Marie and Polsenberg Joyce
Current Estimated Value
Purchase Details
Closed on
Oct 5, 2004
Sold by
Polsenberg Regina M
Bought by
The Regina M Polsenberg 2004 Qprt
Purchase Details
Closed on
Oct 4, 2004
Sold by
Polsenberg John and Polsenberg Regina
Bought by
Polsenberg John M and Polsenberg Regina M
Purchase Details
Closed on
Jun 17, 1999
Sold by
Luadecke Margaret
Bought by
Polsenberg John and Polsenberg Regina
Home Financials for this Owner
Home Financials are based on the most recent Mortgage that was taken out on this home.
Original Mortgage
$800,000
Outstanding Balance
$213,422
Interest Rate
7.19%
Estimated Equity
$4,766,825
Purchase Details
Closed on
Sep 26, 1991
Sold by
New Jersey Dep
Bought by
Luedecke Henry M and Luedecke Margaret F
Create a Home Valuation Report for This Property
The Home Valuation Report is an in-depth analysis detailing your home's value as well as a comparison with similar homes in the area
Home Values in the Area
Average Home Value in this Area
Purchase History
| Date | Buyer | Sale Price | Title Company |
|---|---|---|---|
| Thomas Ann Marie | -- | None Available | |
| Thomas Ann Marie | -- | None Available | |
| The Regina M Polsenberg 2004 Qprt | -- | -- | |
| The John M Polsenberg 2004 Qprt | -- | -- | |
| Polsenberg John M | -- | -- | |
| Polsenberg John | $880,000 | -- | |
| Luedecke Henry M | $8,000 | -- |
Source: Public Records
Mortgage History
| Date | Status | Borrower | Loan Amount |
|---|---|---|---|
| Open | Polsenberg John | $800,000 |
Source: Public Records
Tax History Compared to Growth
Tax History
| Year | Tax Paid | Tax Assessment Tax Assessment Total Assessment is a certain percentage of the fair market value that is determined by local assessors to be the total taxable value of land and additions on the property. | Land | Improvement |
|---|---|---|---|---|
| 2025 | $18,595 | $3,028,500 | $2,600,000 | $428,500 |
| 2024 | $18,595 | $3,028,500 | $2,600,000 | $428,500 |
| 2023 | $18,444 | $3,028,500 | $2,600,000 | $428,500 |
| 2022 | $17,202 | $3,028,500 | $2,600,000 | $428,500 |
| 2021 | $16,566 | $3,028,500 | $2,600,000 | $428,500 |
| 2020 | $15,930 | $3,028,500 | $2,600,000 | $428,500 |
| 2019 | $15,445 | $3,028,500 | $2,600,000 | $428,500 |
| 2018 | $14,779 | $3,028,500 | $2,600,000 | $428,500 |
| 2017 | $15,760 | $2,834,600 | $2,400,000 | $434,600 |
| 2016 | $15,590 | $2,834,600 | $2,400,000 | $434,600 |
| 2015 | $15,335 | $2,834,600 | $2,400,000 | $434,600 |
| 2014 | $15,165 | $2,834,600 | $2,400,000 | $434,600 |
Source: Public Records
Map
Nearby Homes
- 110 Pelican Dr S
- 118 Pelican Dr S
- 106 Pelican Dr S
- 122 Pelican Dr S
- 102 Pelican Dr S
- 126 Pelican Dr S
- 98 Pelican Dr S
- 130 Pelican Dr S
- 81 Pelican Dr S
- 7 Heron Dr
- 94 Pelican Dr S
- 134 Pelican Dr S
- 6 Heron Dr
- 77 Pelican Dr S
- 10 Heron Dr
- 93 Pelican Dr S
- 11 Heron Dr
- 90 Pelican Dr S
- 138 Pelican Dr S
- 73 Pelican Dr S