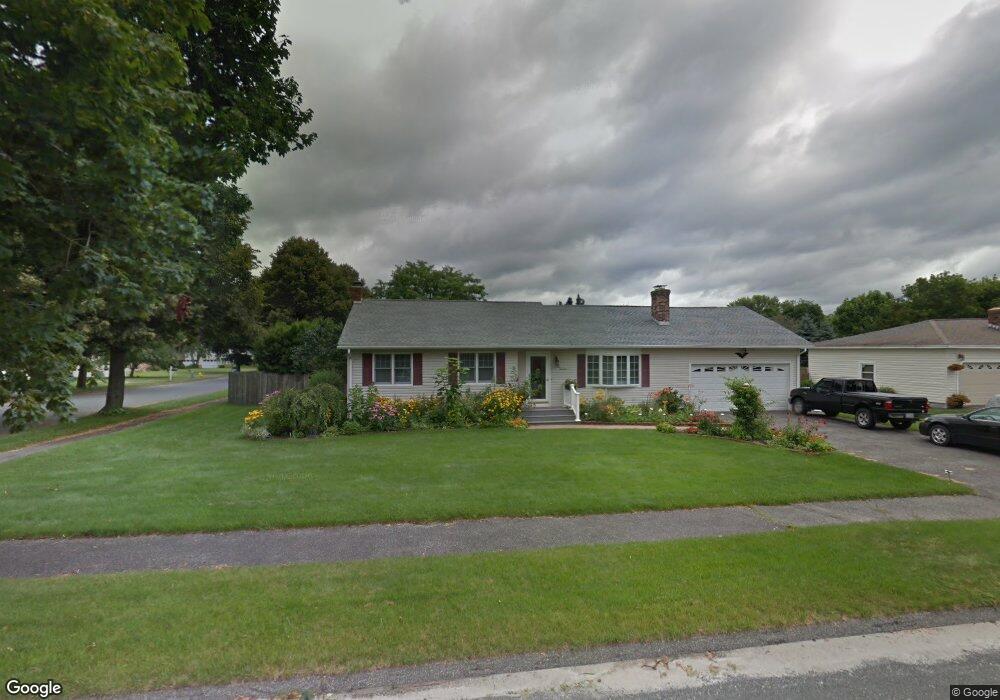
114 Quirico Dr Pittsfield, MA 01201
Estimated Value: $343,000 - $376,000
3
Beds
2
Baths
1,378
Sq Ft
$265/Sq Ft
Est. Value
About This Home
This home is located at 114 Quirico Dr, Pittsfield, MA 01201 and is currently estimated at $365,284, approximately $265 per square foot. 114 Quirico Dr is a home located in Berkshire County with nearby schools including Egremont Elementary School, Theodore Herberg Middle School, and Pittsfield High School.
Ownership History
Date
Name
Owned For
Owner Type
Purchase Details
Closed on
Oct 6, 2000
Sold by
Mcleod Harry E and Mcleod Laurie J
Bought by
Szestowicki Marian and Szesstowicki Irena
Current Estimated Value
Home Financials for this Owner
Home Financials are based on the most recent Mortgage that was taken out on this home.
Original Mortgage
$128,500
Outstanding Balance
$46,996
Interest Rate
7.96%
Mortgage Type
Purchase Money Mortgage
Estimated Equity
$318,288
Purchase Details
Closed on
Sep 23, 1991
Sold by
Schafer Larry W and Schafer Laraine E
Bought by
Mcleod Harry E and Mcleod Laurie J
Create a Home Valuation Report for This Property
The Home Valuation Report is an in-depth analysis detailing your home's value as well as a comparison with similar homes in the area
Home Values in the Area
Average Home Value in this Area
Purchase History
| Date | Buyer | Sale Price | Title Company |
|---|---|---|---|
| Szestowicki Marian | $132,000 | -- | |
| Szestowicki Marian | $132,000 | -- | |
| Mcleod Harry E | $107,000 | -- | |
| Mcleod Harry E | $107,000 | -- |
Source: Public Records
Mortgage History
| Date | Status | Borrower | Loan Amount |
|---|---|---|---|
| Open | Mcleod Harry E | $128,500 | |
| Closed | Mcleod Harry E | $128,500 | |
| Previous Owner | Mcleod Harry E | $43,000 |
Source: Public Records
Tax History
| Year | Tax Paid | Tax Assessment Tax Assessment Total Assessment is a certain percentage of the fair market value that is determined by local assessors to be the total taxable value of land and additions on the property. | Land | Improvement |
|---|---|---|---|---|
| 2025 | $5,382 | $300,000 | $91,200 | $208,800 |
| 2024 | $5,323 | $288,500 | $91,200 | $197,300 |
| 2023 | $4,959 | $270,700 | $91,200 | $179,500 |
| 2022 | $4,590 | $247,300 | $91,200 | $156,100 |
| 2021 | $4,516 | $234,600 | $91,200 | $143,400 |
| 2020 | $4,230 | $214,600 | $76,200 | $138,400 |
| 2019 | $4,010 | $206,500 | $71,200 | $135,300 |
| 2018 | $3,932 | $196,500 | $66,200 | $130,300 |
| 2017 | $3,565 | $181,600 | $56,200 | $125,400 |
| 2016 | $3,482 | $185,600 | $56,200 | $129,400 |
| 2015 | $3,352 | $185,600 | $56,200 | $129,400 |
Source: Public Records
Map
Nearby Homes
Your Personal Tour Guide
Ask me questions while you tour the home.