Estimated Value: $222,000 - $249,000
3
Beds
2
Baths
1,415
Sq Ft
$164/Sq Ft
Est. Value
About This Home
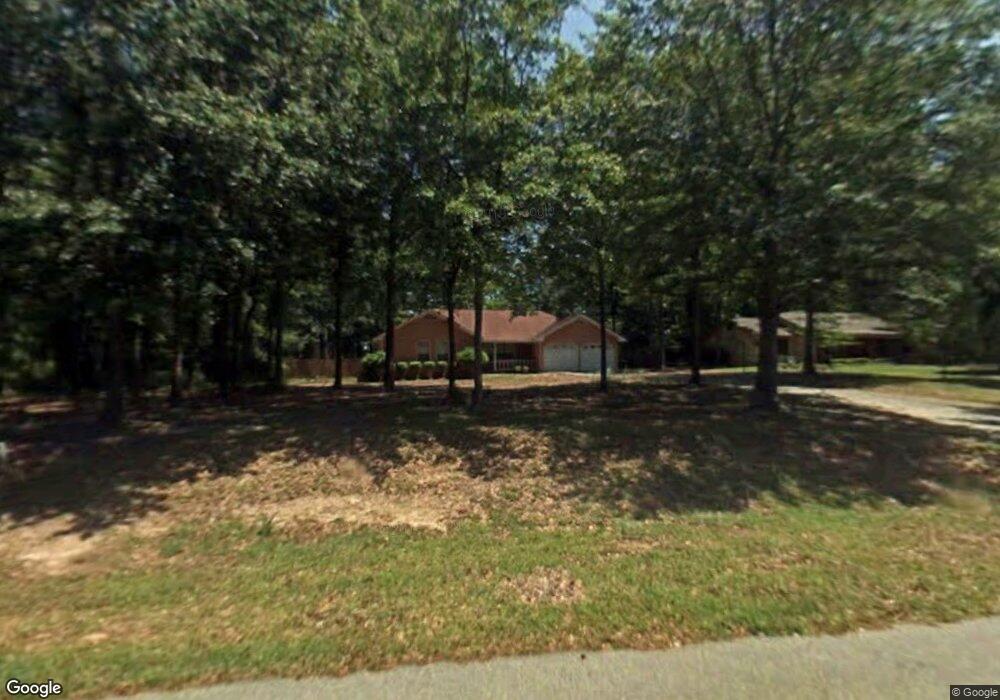
This home is located at 114 Red Oak Ct, Byron, GA 31008 and is currently estimated at $232,076, approximately $164 per square foot. 114 Red Oak Ct is a home located in Peach County with nearby schools including Byron Elementary School, Byron Middle School, and Peach County High School.
Ownership History
Date
Name
Owned For
Owner Type
Purchase Details
Closed on
Oct 18, 2017
Sold by
Hardy Amanda T
Bought by
Taylor Melissa Jean and Taylor Maria S
Current Estimated Value
Home Financials for this Owner
Home Financials are based on the most recent Mortgage that was taken out on this home.
Original Mortgage
$116,353
Outstanding Balance
$97,318
Interest Rate
3.87%
Mortgage Type
FHA
Estimated Equity
$134,758
Purchase Details
Closed on
Mar 10, 2010
Sold by
Grinstead John E
Bought by
Thrasher Amanda C
Home Financials for this Owner
Home Financials are based on the most recent Mortgage that was taken out on this home.
Original Mortgage
$117,346
Interest Rate
4.93%
Mortgage Type
New Conventional
Purchase Details
Closed on
Nov 10, 1986
Bought by
Grinstead John E and Grinstead Elaine H
Purchase Details
Closed on
Apr 24, 1986
Bought by
Chambers Tom
Create a Home Valuation Report for This Property
The Home Valuation Report is an in-depth analysis detailing your home's value as well as a comparison with similar homes in the area
Home Values in the Area
Average Home Value in this Area
Purchase History
| Date | Buyer | Sale Price | Title Company |
|---|---|---|---|
| Taylor Melissa Jean | $118,500 | -- | |
| Thrasher Amanda C | $115,000 | -- | |
| Grinstead John E | $64,000 | -- | |
| Chambers Tom | $8,000 | -- |
Source: Public Records
Mortgage History
| Date | Status | Borrower | Loan Amount |
|---|---|---|---|
| Open | Taylor Melissa Jean | $116,353 | |
| Previous Owner | Thrasher Amanda C | $117,346 |
Source: Public Records
Tax History Compared to Growth
Tax History
| Year | Tax Paid | Tax Assessment Tax Assessment Total Assessment is a certain percentage of the fair market value that is determined by local assessors to be the total taxable value of land and additions on the property. | Land | Improvement |
|---|---|---|---|---|
| 2024 | $2,234 | $62,600 | $13,400 | $49,200 |
| 2023 | $2,065 | $57,480 | $7,280 | $50,200 |
| 2022 | $1,372 | $50,960 | $7,280 | $43,680 |
| 2021 | $1,424 | $45,600 | $7,280 | $38,320 |
| 2020 | $1,437 | $46,040 | $7,280 | $38,760 |
| 2019 | $1,445 | $46,040 | $7,280 | $38,760 |
| 2018 | $1,452 | $46,040 | $7,280 | $38,760 |
| 2017 | $1,396 | $46,040 | $7,280 | $38,760 |
| 2016 | $1,390 | $46,040 | $7,280 | $38,760 |
| 2015 | $1,392 | $46,040 | $7,280 | $38,760 |
| 2014 | $1,394 | $46,040 | $7,280 | $38,760 |
| 2013 | -- | $46,040 | $7,280 | $38,760 |
Source: Public Records
Map
Nearby Homes
- 112 Red Oak Ct
- 116 Red Oak Ct
- 168 Red Tail Cir
- 122 Red Tail Cir
- 127 Red Tail Cir
- 174 Red Tail Cir
- 147 Red Tail Cir
- 142 Red Tail Cir
- 108 Red Oak Ct
- 118 Red Oak Ct
- 0 Red Oak Ct Unit 3259941
- 115 Red Oak Ct
- 107 Red Oak Ct
- 104 Red Oak Ct
- 120 Red Oak Ct
- 117 Red Oak Ct
- 119 Red Oak Ct
- 271 Red Oak Rd
- 1130 W White Rd
- 269 Red Oak Rd