114 Riva Trace Dr Cary, NC 27513
West Cary NeighborhoodEstimated Value: $498,000 - $522,000
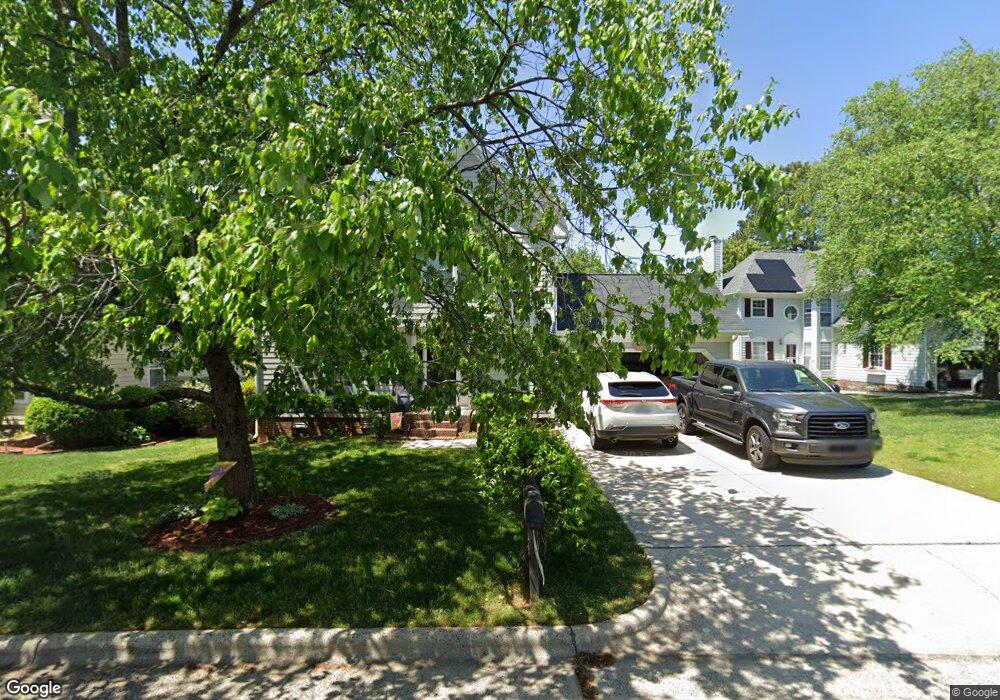
About This Home
This home is located at 114 Riva Trace Dr, Cary, NC 27513 and is currently estimated at $506,173, approximately $294 per square foot. 114 Riva Trace Dr is a home located in Wake County with nearby schools including Laurel Park Elementary, Salem Middle, and Green Hope High.
Ownership History
We collect this data history from publicly available records. To have your information removed, we recommend requesting removal directly through your county’s website.
Purchase Details
Purchase Details
Home Financials for this Owner
Home Financials are based on the most recent Mortgage that was taken out on this home.Purchase Details
Home Financials for this Owner
Home Financials are based on the most recent Mortgage that was taken out on this home.Home Values in the Area
Average Home Value in this Area
Purchase History
We collect this data history from publicly available records. To have your information removed, we recommend requesting removal directly through your county’s website.
| Date | Buyer | Sale Price | Title Company |
|---|---|---|---|
| -- | None Available | ||
| $181,500 | -- | ||
| $167,000 | -- |
Mortgage History
We collect this data history from publicly available records. To have your information removed, we recommend requesting removal directly through your county’s website.
| Date | Status | Borrower | Loan Amount |
|---|---|---|---|
| Open | $145,200 | ||
| Previous Owner | $148,000 |
Tax History
We collect this data history from publicly available records. To have your information removed, we recommend requesting removal directly through your county’s website.
| Year | Tax Paid | Tax Assessment Tax Assessment Total Assessment is a certain percentage of the fair market value that is determined by local assessors to be the total taxable value of land and additions on the property. | Land | Improvement |
|---|---|---|---|---|
| 2025 | $4,000 | $464,384 | $165,000 | $299,384 |
| 2024 | $3,914 | $464,384 | $165,000 | $299,384 |
| 2023 | $3,202 | $317,566 | $105,000 | $212,566 |
| 2022 | $3,083 | $317,566 | $105,000 | $212,566 |
| 2021 | $3,021 | $317,566 | $105,000 | $212,566 |
| 2020 | $3,037 | $317,566 | $105,000 | $212,566 |
| 2019 | $2,693 | $249,624 | $88,000 | $161,624 |
| 2018 | $2,527 | $249,624 | $88,000 | $161,624 |
| 2017 | $2,429 | $249,624 | $88,000 | $161,624 |
| 2016 | $2,393 | $249,624 | $88,000 | $161,624 |
| 2015 | $2,202 | $221,661 | $60,000 | $161,661 |
| 2014 | $2,077 | $221,661 | $60,000 | $161,661 |
Map
- 119 Trailview Dr
- 112 Conway Ct
- 106 Stokesay Ct
- 101 Dovershire Ct
- 112 Bebington Dr
- 200 Bebington Dr
- 128 Wheatsbury Dr
- 127 Maldon Dr
- 330 Bond Lake Dr
- 211 Stablegate Dr
- 222 Custer Trail
- 419 Methven Grove Dr
- 311 Schubauer Dr
- 120 Plyersmill Rd
- 208 Arlington Ridge
- 209 Plyersmill Rd
- 701 Royal Tower Way
- 535 Methven Grove Dr
- 161 Hilda Grace Ln
- 110 Mereworth Place
- 116 Riva Trace Dr
- 112 Riva Trace Dr
- 114 Covewood Ct
- 118 Riva Trace Dr
- 112 Covewood Ct
- 121 Covewood Ct
- 110 Riva Trace Dr
- 109 Riva Trace Dr
- 107 Riva Trace Dr
- 108 Riva Trace Dr
- 111 Riva Trace Dr
- 303 Woodstar Dr
- 119 Covewood Ct
- 301 Woodstar Dr
- 110 Covewood Ct
- 106 Riva Trace Dr
- 105 Riva Trace Dr
- 113 Riva Trace Dr
- 115 Riva Trace Dr
- 108 Covewood Ct
Ask me questions while you tour the home.